

Technische Universität Wien
Orientation and Processing of Airborne Laser Scanning data
Department of Geodesy and Geoinformation - Research Groups Photogrammetry and Remote Sensing

Provides an interactive 3d viewer for points (including arbitrary attributes) and lines.
This module requires the installation of the Option: Matlab Runtime.
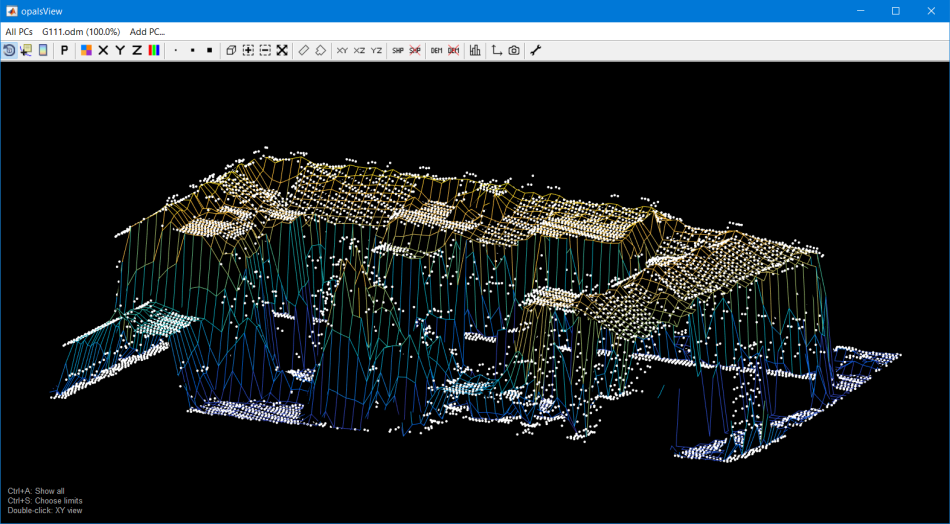
The main purpose of this module is the visualization of point clouds in the ODM format. The main features of opalsView are:
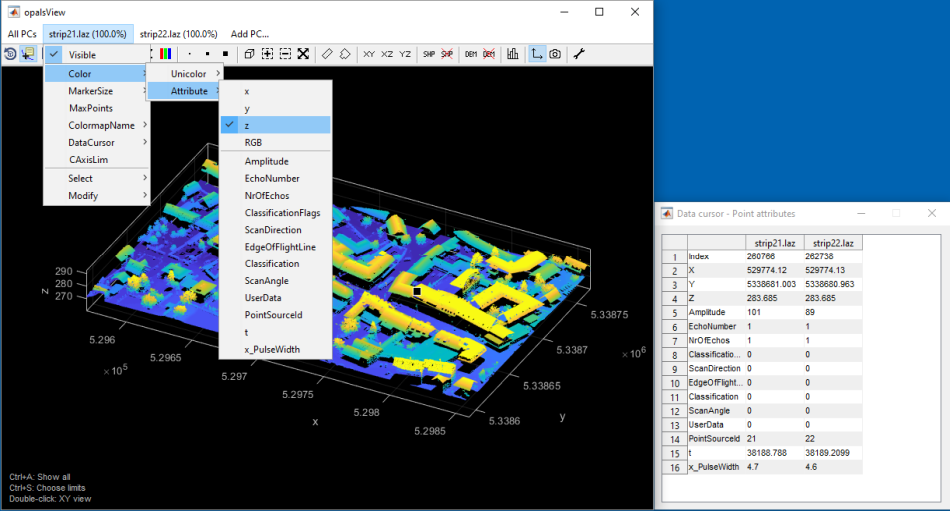
The data cursor (second icon in the toolbar) can be used to show and compare point attributes of multiple point clouds. If a point is selected in the point cloud, the corresponding attributes are displayed in a new window. The attributes to be analysed, can be selected in DataCursor -> Select attributes. To show or hide point clouds in the attribute table click DataCursor -> Show PC attributes. If multiple point clouds are opened, points can be compared by allowing a snap radius, which can be specified in the Options dialog.
The data used in the following examples can be found in the $OPALS_ROOT/demo/ directory.
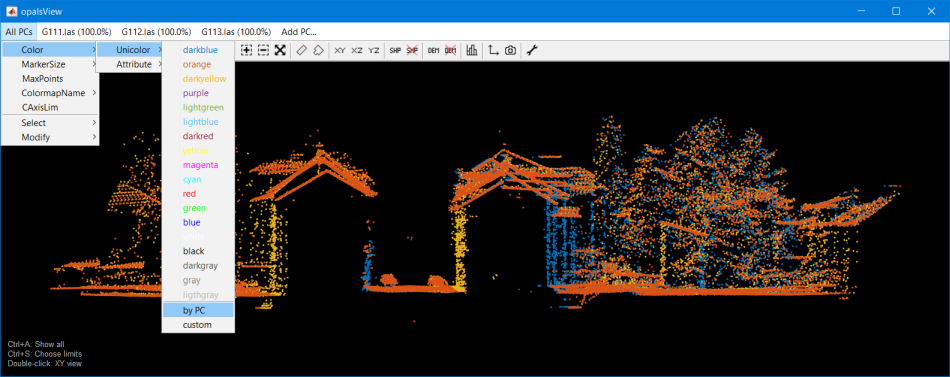
In this example three ALS strips are visualized using opalsView. As a first step, we have to import the strips, which are given in las format, using Module Import :
Now opalsView can be called:
If the ODM file contains informations about the normal vectors, they can be visualized with opalsView. First, let's import the point cloud and estimate the normal vectors:
Now opalsView can be called to visualize the point cloud together with the normal vectors:
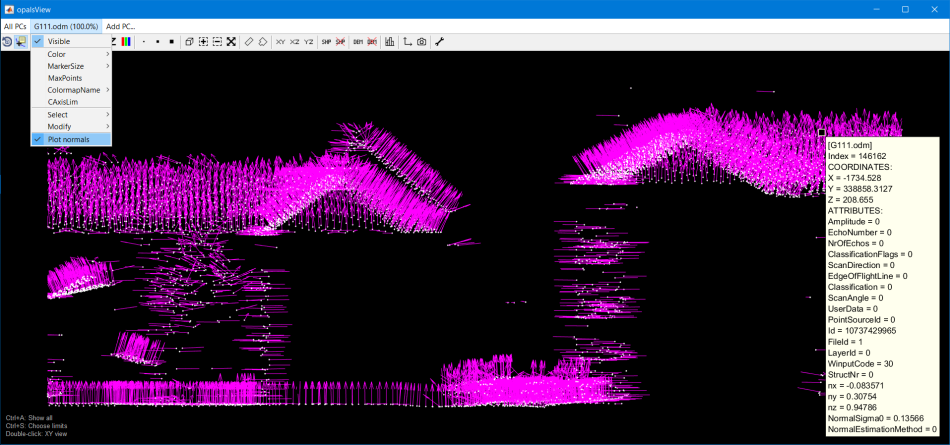
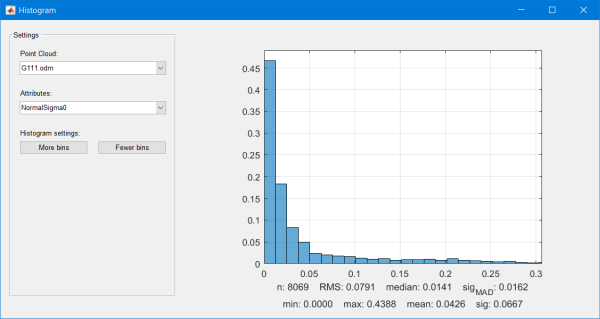
Coloring and lenght of the normal vectors can be adjusted in the options. A histogram of the currently displayed points can be opened with the histogram button in the toolbar of opalsView:
In opalsView a DEM (in GeoTiff format) can be visualized together with the point clouds. First, the DEM is estimated using Module Grid :
After opening the file in opalsView, the DEM can be added with the "DEM" button in the toolbar:
 1.8.17