- See also
- opals::IIsolines
Aim of module
Derives contour lines (isolines) from grid models and stores them as a vector dataset.
General description
Contour lines are a convenient method to get a cartographic 2D representation of the 3D structure of a DTM. Typically an interval will be specified to get contour lines with equally spaced height intervals. The zRange may be specified optionally to reduce this height range. Individual levels may be specified alone or together with interval.
The contour lines can be additionally controlled by the following parameters: Small closed contours can be suppressed with parameter closeMin. Closed contours smaller than the given minimum area will not be written to the output file.
To derive the contour lines densification points will be calculated to get more pleasant results at the expense of calculation time. The calculation of these intermediate points may be suppressed by setting the option densification to false.
There is another option thinOut to reduce the number of points in the output file. The number of points is reduced by using the Douglas-Peucker algorithm. This is done by default using a very low perpendicular tolerance of 0.01 (1 cm) not to change the contour lines in an unexpected manner. Be careful using this parameter with higher values, because the local shape of contours may change unexpectedly.
Parameter description
-inFileinput grid model file
Type:
opals::Path
Remarks: mandatory
The input grid model file is expected in a GDAL supported data format.
-outFileoutput file (contour lines)
Type:
opals::Path
Remarks: estimable
The contour lines are stored as vector dataset. Estimation rule: input file name + '_iso' + <.ext>.
-oFormatoutput vector file format
Type:
opals::String
Remarks: estimable
Supported vector formats: SHP
Estimation rule: The output format is estimated based on the extension of the output file (*.shp->SHP, ...).
-bandinput band number
Type:
opals::String
Remarks: default=0
To select the desired band of a multi-layer input raster file. Bands are numbered from 1.
-intervalequidistance intervals
Type:
opals::Vector<double>
Remarks: optional
Equidistance intervals for contour lines. If neither option -interval nor option -levels is specified, a reasonable interval will be estimated.
-levelsindividual levels
Type:
opals::Vector<double>
Remarks: optional
Individual levels for contour lines may be specified. If neither option -interval nor option -levels is specified, a reasonable interval will be estimated.
-zRangerange (zmin, zmax) for contour lines
Type:
opals::Array<double, 2>
Remarks: optional
Range (zmin zmax) of z-values considered for output. Only contour lines within the given 'zRange' will be calculated. If not specified, the entire z-range of the input grid model is used.
-thinOutallowed lateral deviation for thinout.
Type: double
Remarks: default=0.01
Thin out contour lines with Douglas-Peucker algorithm. The maximum allowed deviation from the original contour line can be specified. Be careful if using this parameter because thinning out may have a bad effect on the form of contour lines.
-closeMinsuppress closed contours with area < closeMin
Type: double
Remarks: optional
If this parameter is specified closed contour lines with an area smaller than the specified value will not be written to the output file.
-minLengthsuppress short contours
Type: double
Remarks: optional
If this parameter is specified contour lines with a length smalles than the specified value will not be written to the output file.
-densificationintermediate densification of grid
Type: bool
Remarks: default=1
Iterpolate intermediate densification points to get more pleasant contours.Setting this option to 0 will switch off densification.
-styleIGroup: Style options for multiple intervals/levels
The values of this group are added in a GDAL/OGR conform way as attribute column to each contour line object.
.attributestyles
Type:
opals::String
Remarks: default=OGR_STYLE
Specifies the name of the attribute.
.intervalintervals
Type:
opals::Vector<
opals::String>
Remarks: optional
Specifies the style of the intervals. If only one value is provided this value is taken for all the specified intervals. Otherwise has to be either empty or the same size as intervals.
.levelsstyles
Type:
opals::Vector<
opals::String>
Remarks: optional
Specifies the style of the fixed levels. If only one value is provided this value is taken for all the specified levels. Otherwise has to be either empty or the same size as levels.
-maxSlopethreshold of maximum slope to consider for intervals
Type:
opals::Vector<
opals::AngleType>
Remarks: optional
The maxSlope is set independently for each interval. The resulting isolines consist of several smaller parts, of which only the ones in areas with a smaller slope than specified are shown. For calculating the slope the Zevenbergen and Thorne algorithm is used. If set to 0 no maxSlope is assumed.
AngleType: Defines an angle value in combination with different angle units. As units radiants (rad), degrees (deg), gradians (grad) and precentages (%) are support. Append the corresponding unit abbreviation within or without square brackets. E.g. '45[deg]', '100', '50grad' are all valid defintion and result in the same angle value. If a value is given without unit, degrees are assumed.
Syntax: <deg-angle> | <angle>[deg | rad | grad | %] -maxBridgeDistsuppress small gaps between line parts
Type: double
Remarks: optional
Use this parameter in combination with maxSlope, to specify the treatment of gaps in the isolines.If a gap is smaller than the maxBridgeDist, the gap between the line parts will be closed.
Examples
The data used in the subsequent examples are located in the $OPALS_ROOT/demo/ directory and the following preprocessing steps (data import and surface grid calculation) are required:
opalsShade -inFile flyover_dtm.tif
Example 1
The first example shows a typical run of opalsIsolines specifying the mandatory parameter inFile together with parameter interval.
It produces contour lines from the DTM fullwave2_dtm.tif with a contour interval of 5 meters.
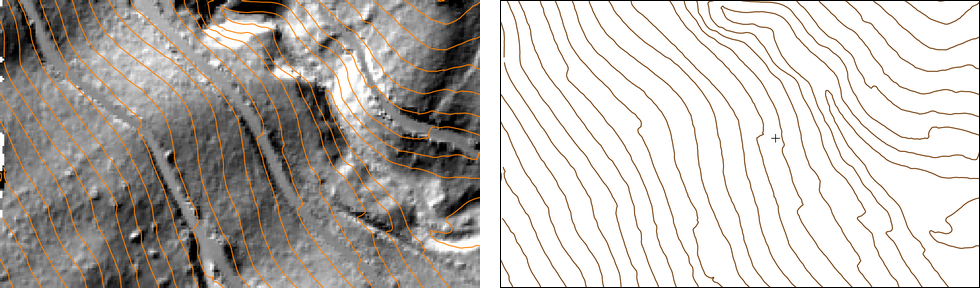
Output of Example 1
Example 2
In the second example only the mandatory parameter inFile is specified. Thus, the command is very short and simple:
It produces contour lines from the DTM flyover_dtm.tif with an equidistant interval estimated from the z-range of the DTM. The interval is estimated and rounded to a commonly used interval out of 10, 20, 25, 50 times a power of 10. In this case opalsIsolines estimates an interval of 1 m, which is fairly suitable. But typically one will specify an interval customized to the project (like in the first example).
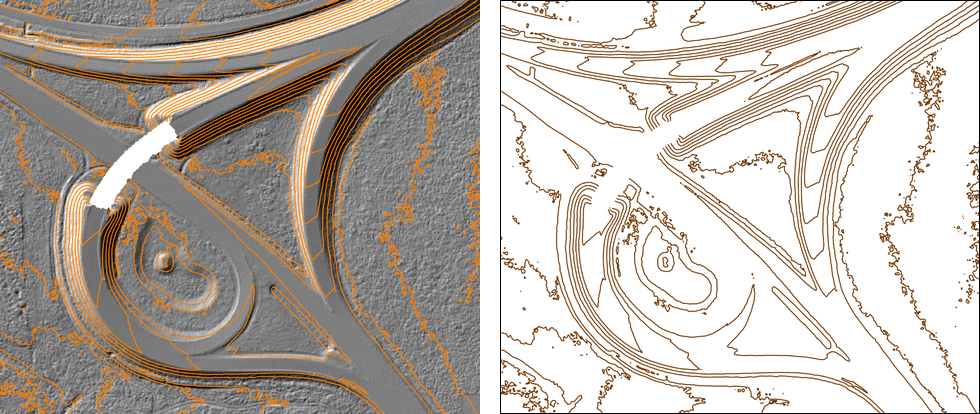
Output of Example 2
Example 3
In example 2 we can see that in rough terrain we will get a lot of small closed contours. This type of fragmented contours are often not wanted in contour maps. We can suppress the output of such small closed contour lines specifying the additional option closeMin with a reasonable value for the minimum area of a closed contour line to be selected for output.
In this case all closed contours with an area smalles than 10 square meters will be suppressed.
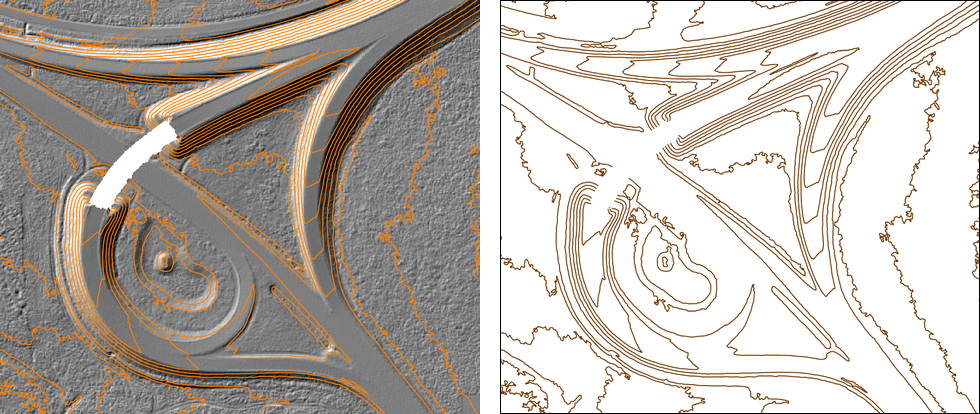
Output of Example 3
Example 4
Another option (zRange) allows us to limit the height range to a lower and upper limit. Only contour lines beetween these limis will be produced.
Output of Example 4
Example 5
It is also possible to generate contour lines of individual levels by using the option levels and explicitly specifying the wanted levels.
Output of Example 5
Example 6: Adding style information
With the parameter group style an additional column is added to each contour line object. The default name for this column is OGR_STYLE but can be set to any string via style.attribute.
The styles for the levels and intervals can be set independently for each value, or one value for all of the levels resp. intervals can be set. In the below example the set fixed levels are both to be drawn in red with a short-dash line, while the intervals are all to be in different colors and line widths. See OGR Feature Styles for more information on the syntax to be used.
opalsIsolines -inFile fullwave2_dtm.tif -.interval 2 5 10 -.levels 250.5 251.75 -
style.levels
"PEN(c:#d62400, w:1.5px, p:3px 1px)" -
style.interval
"PEN(c:#4b6fe4, w:1px)" "PEN(c:#e3af12, w:1.5px)" "PEN(c:#f7f705, w:2px)" -
zRange 230 260
With the attribute name left on OGR_STYLE, the style information is automatically applied when the shapefile is converted to e.g. a PDF with ogr2ogr. To convert the produced shapefile from this example to a PDF use:
ogr2ogr fullwave2_dtm_iso.pdf fullwave2_dtm_iso.shp
Overlaying the shaded Tif with the Isolines can be achieved with gdal_translate in the following way:
gdal_translate -of PDF fullwave2_dtm_shd.tif fullwave2_dtm_iso_shd.pdf -co OGR_DATASOURCE=fullwave2_dtm_iso.shp

Output of Example 6
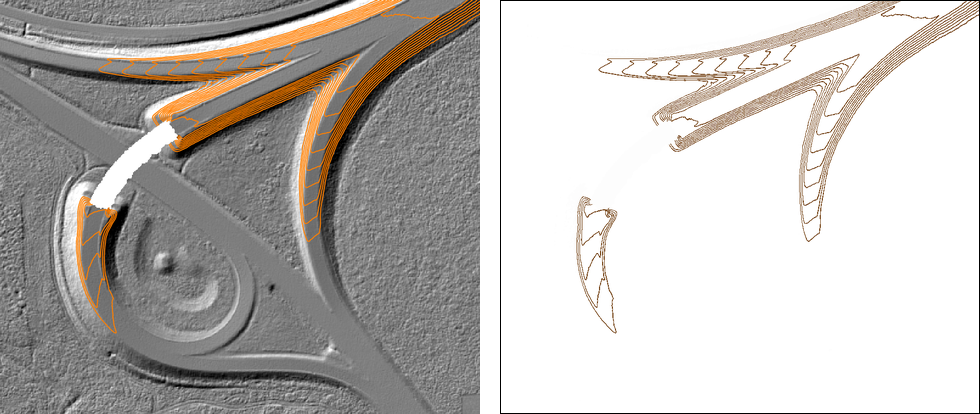
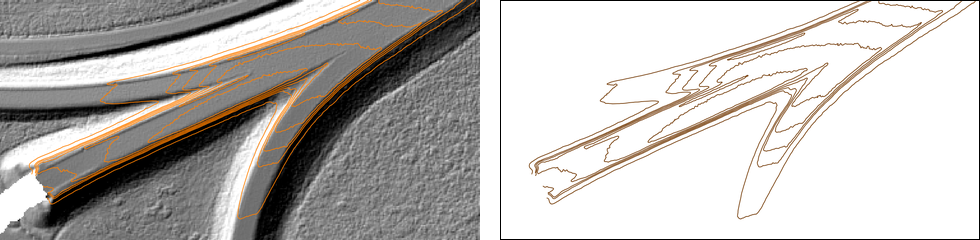
Example 7: Specifying maximum slopes
By setting the parameter maxSlope for each individual interval, it is possible to limit the lines to below certain slopes. If e.g. the landscape contains both, very steep and very flat areas, an overload of the drawn isolines in the steep areas can be prevented. In the below example if the terrain is flat (slope under 30°) the lines are shown in an interval of 2.5m. The 5m interval should always be shown, therefore the maxSlope is set to 0.

Map extent in QGIS for showing slope dependent isolines
The resulting isolines now consist of multiple line parts. To get more coherent lines the parameters maxBridgeDist and minLength can be specified.

Slope dependent isolines with minLength and maxBridgeDist
- Author
- bw, jb
- Date
- 09.05.2023
 1.8.17