Technische Universität Wien
Orientation and Processing of Airborne Laser Scanning data
Department of Geodesy and Geoinformation - Research Groups Photogrammetry and Remote Sensing
Derives color coded visualizations of grid models and stores them as geo-coded raster images.
Basically, z-coloring is a classification task separating the z range of the grid model into distinct classes and assigning a specific color to each class. Thus, the process can be split up in two parts: the definition of classes and the assignment of color values to each class.
The main instrument for controlling both the class definition and color assignment is the palette file (parameter palFile). Palette files always map the entire z-range from - \(\infty\) to + \(\infty\), thus, the general form of the palette file is:
| Z (index) | Color (value) | Remark |
| - \(\infty\) | color0 | underflow color |
| index1 | color1 | index1 = index min |
| index2 | color2 | ... |
| ... | ... | ... |
| indexn | colorn | overflow color, index n = index max |
Basically, the palette file can be seen as a step function mapping z values (index) to colors (value). Thematic maps mainly using irregular class boundaries (e.g. traffic-light-maps indicating good-medium-bad quality, maps of laser scanning strip differences indicating areas with good or bad consistency) can be derived easily that way. No interpolation of intermediate colors is performed as the classes of the output raster file exactly match the classes of the palette file. Another standard application is the derivation of color coded maps using continuous/equidistant classes and smooth color transitions. Therefore, additional parameters are provided to overrule the class division as given in the palette file. Equidistant classes can be defined by specifying a class interval (parameter interval) or a desired number of classes (parameter nClasses). In this case the palette is interpreted as a piecewise linear function and intermediate colors are interpolated in the center of each class to get a look-up-table. This is the intended way for deriving e.g. hypsometric views of the terrain.
By default, the indices of the palette file equal the z-values of the grid model. Additional parameters for scaling (parameter scalePal) and offsetting (parameter offsetPal) the indices are provided. In general, the following scaling options are provided
| scalePal | offsetPal | Description |
| scale (float) | offset (float) | The class bounds are calculated using the following formula: class bound = offset + index * scale |
| low high (float float) | — | The class bounds are calculated by stretching the palette index domain (index min to index max,) to the given reach (low to high). The same formula as above is applied (scale and offset are calculated internally). Parameter offsetPal is ignored in this case. |
| auto | — | The class bounds are calculated by stretching the palette index domain (index min to index max,) to the valid z-range of the grid model. The same formula as above is applied (scale and offset are calculated internally). Parameter offsetPal is ignored in this case. scalePal=auto is normally used together with palettes containing indices ranging from 0 to 100, allowing a percentage interpretation of the palette. |
The resulting colour lookup table can be output as a scalable vector graphics (SVG) file together with the z-coded raster map itself (parameter legend). Optionally, the z-range can be clipped using parameter zRange, otherwise the entire range of grid values is used. User defined XY-limits (parameter limits) for the output grid model can either refer to the centers (=default) or corners of the outermost pixels (c.f. parameter limit description). Finally, in case the input and output grid do not coincide, the re-sampling method controlling the (internal) interpolation of input grid pixel z-values can be specified (parameter resampling).
A palette file is a simple XML file containing an element <OpalsPalette> which itself contain the following elements:
<name> Optional<comment> Optional<classes> This optional element has a mandatory attribute val containing the number of classes to be used by default (if neither parameter interval nor parameter nClasses will be specified).<values> This element has a mandatory attribute type which value can be "RGB255" or "RGB".and 3 to 256 elements
<entry> Each of these elements must have the following attributes:val R red color component valueG green color component valueB blue color component valueand an optional attribute comment.
An image with indexed colors can contain no more than 256 colors. As we need a background color (BG) and one for values smaller than zmin (uf) and for values greater than zmax each, we can only have a maximum of 253 classes beetween zmin and zmax. If the number of classes specified by nClasses or calculated from other parameters is larger than 253 the resulting image will be a RGB-image.
Here is a simple example of a palette file:
The first two lines are only necessary to view the palette file with a WEB browser. The third line is a comment.
An OPALS distribution contains the following standard palettes:
standardPal.xml: used for terrain elevation codings (green land to brown mountains)
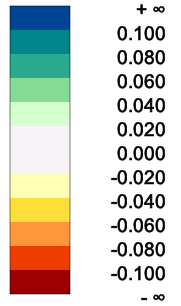
differencePal.xml: used for visualizations of (strip) differences (negative differences: blue, positive differences: red)
densityPal.xml: used for point density maps (poor density: red, yellow, satisfying density: green)
aspectPal.xml: terrain aspect
slopePal.xml: terrain slope
greyPal.xml: simple black-to-white palette for multiple purposes
Additional ColorBrewer palettes: ColorBrewer is providing cartographic color schemes
The data used in the subsequent examples are located in the $OPALS_ROOT/demo/ directory and the follwing preprocessing steps (data import, surface grid and difference model calculation) are required:
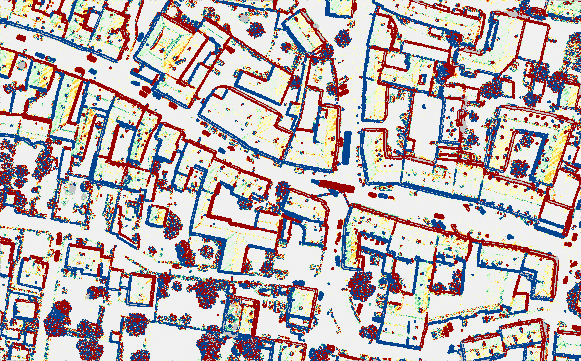
Example 1: Visualization of vertical strip differences
This is a typical example, visualizing the height differences of two laserscanning strips (strip19 and strip20) using the predefined palette differencePal.xml (stored in the default palette directory
$OPALS_ROOT/addons/pal). Since no output raster file is specified, the default file name (diff_11_21_zco.tif) is constructed automatically and GeoTiff is used as output format. The pixel size is automatically set equal to the grid size of the input grid (diff_11_21.tif) as the parameter pixelSize is not specified.
No parameters for continuous class division are specified, thus, the indices of the palette (scaled by the given factor of 0.02) define the class bounds. Therefore the used class bounds are: -0.10 -0.08 -0.06 -0.04 -0.02 0.00 +0.02 +0.04 +0.06 +0.08 +0.10. Differences smaller +/-2 cm are shown in a light grey, differences between 2-6cm appear in light colours, and for larger differences dark colours are used. Pixels with absolute strip differences greater than 10cm (0.02 * 5) will get the overflow color and underflow color respectively.
Example 2: Hypsometric terrain visualizations
One of the typical applications of ZColor is the derivation of color coded terrain visualizations.
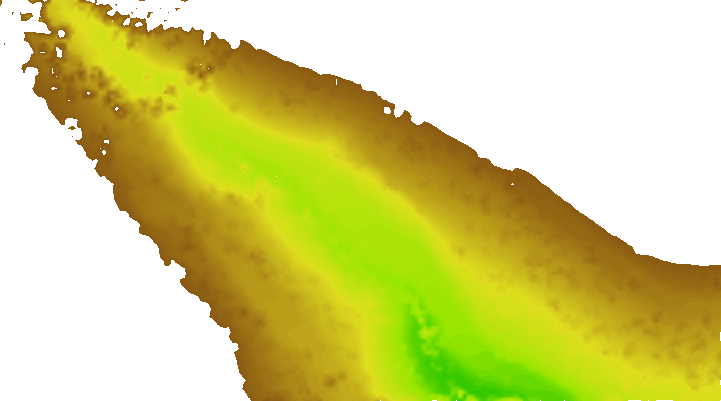
Equidistant 0.5m class intervals are used overruling the class bounds given in the palette file. Automatic stretching of the user defined 270-330m z-range to the index range 09900(%) is performed due to scalePal=auto. Based on the input grid file (fullwave.tif) a hypsometric raster image map (terrain-hypso.tif) is derived in GeoTiff file format (automatically estimated from the .tif extension) with a pixel size of 0.25m. No palette file is specified, therefore the built-in standard palette will be used, which is equivalent to the following palette
 1.8.17