Technische Universität Wien
Orientation and Processing of Airborne Laser Scanning data
Department of Geodesy and Geoinformation - Research Groups Photogrammetry and Remote Sensing
calculates the top height of forests, along with other statistical features.
The top height (german: Oberhöhe) is defined as the "mean height of the 100 strongest trees per hectare". Since LIDAR data does not provide tree strength, the 100 highest trees are used instead. For that, a data file containing tree positions and their height (stored in the NormalizedZ-Attribute) is needed.
This can then be processed in two seperate ways:
Using the -radius parameter defines a radius (in meters) for a circle, creating a buffer around each point. For every point, the neighboring points (all the points within the circle) are taken and sorted by their NormalizedZ Attribute. The Top 100 (if more than 100 exist) are used for calculating the statistical features. The default value of -radius 56.419 gives an area of approx. 1 ha.
The calculated features are then written back to the individial point as attributes. All of these attributes start with _forTopHeight and end with the name of the feature. Additionally, the count of points used for the calculation is stored in the _forTopHeightSampleCount-Attribute. It is always between the supplied minimum sample count (-minimumSampleCount, default 20) and 100.
If more than one odm file is supplied, and the files overlap, the search region will extend to the next odm file. (e.g. a tree at the border of one file will also have trees in the other file as neighbors)
Instead of calculating the values for every tree and neighborhood, an ESRI polygon shapefile can be supplied via the -aoi parameter. If this argument is supplied, the program automatically switches to AoI (Area of Interest) mode. In this mode, the top 100 trees within each polygon are used for calculation, and the result is written back to the polygon shapefile as attributes. Since ESRI dbf-Files limit the attribute name length to 10 characters, abbreviations are used (e.g. tHnmin_2 for the -feature nmin:2-Feature).
With a little python knowledge, the script can also easlily be adapted to fit broader use, e.g. selecting the 25%-Quantile instead of the top 100 trees, or access a different attribute. This is not possible via command-line, however.
This example uses a search radius of 30 m.
First, we need to create an odm-File from the datasource:
opalsInfo will show information about currently existing attributes:
Notice the NormalizedZ attribute, which is neccessary for the next step!
This will start the script, calculating the mean, the median and the maximum value within 30 meters of every point. Using the -feature parameter multiple times tells the script to make multiple calculations. This also works with the -inFile parameter, allowing multiple odm files to be processed. Alternatively, ";" may be used as a delimiter for multiple input files.
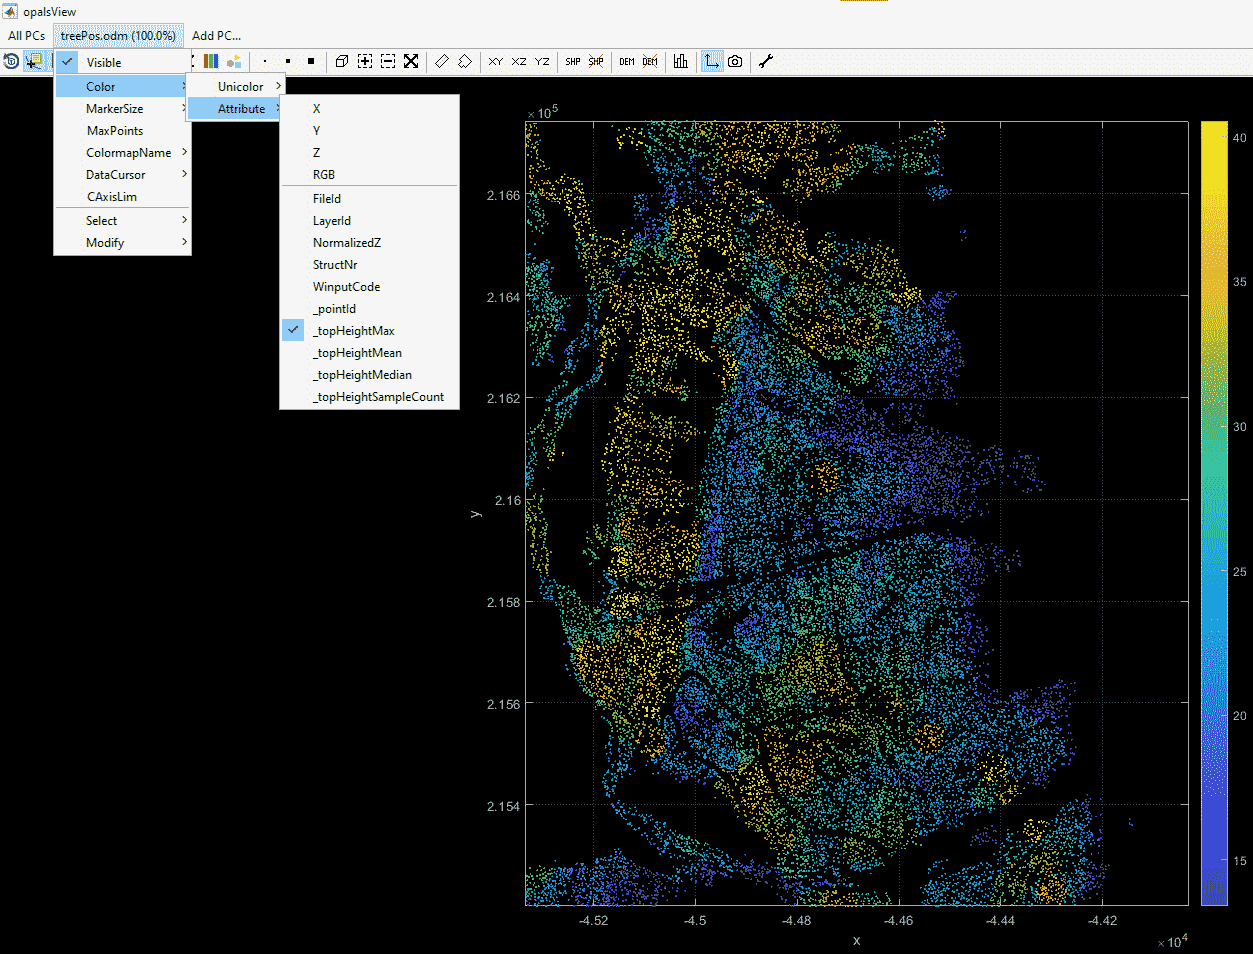
Running opalsInfo again shows us the changes. There should be three new attributes in the attributes list. Not all points might contain all attributes, since the -minSampleCount parameter has been omitted, points need to have at least 20 neighbors for the attribute to be saved.
In this example, a polygon shapefile will be used for detemining neighborhood. Visualisation of the result can easily be done with QGIS.
If you have not already created the odm-File from the datasource, do so now:
We will now use these tree positions to calculate the mean tree height per polygon in the fTH_poly.shp file. No values should be stored, if the polygon contains less than 5 trees.
Finally, let's open the shapefile in QGIS, right click on the layer and select 'Properties'. Go to the 'Style' tab and select 'Graduated' where it says 'Single Symbol'. Under 'Column', select 'tHMean', and after fiddling with the Color ramp and Classes, click 'OK'.
 1.8.17