Module View
See also
opals::IView

Aim of module

Provides an interactive 3d viewer for points (including arbitrary attributes) and lines.

Requirements for usage of opalsView

This module requires the installation of the Matlab runtime.

General description

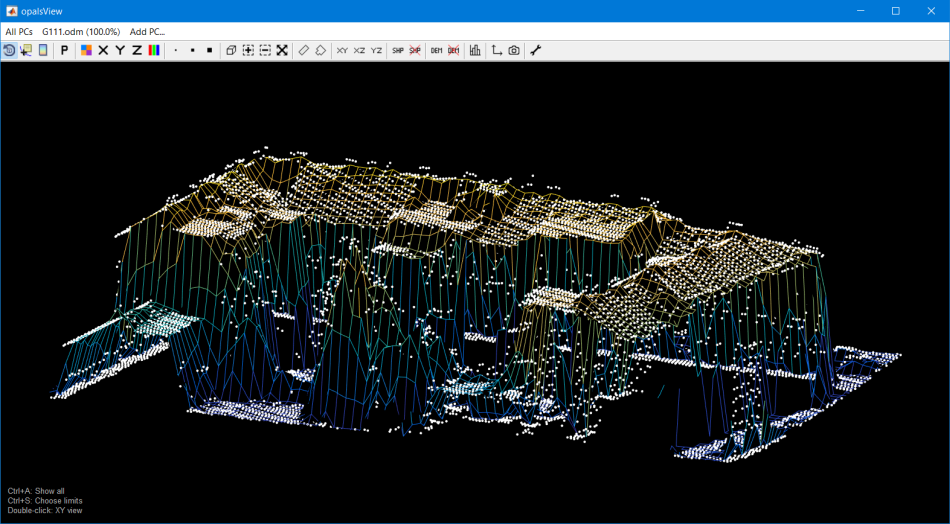
The main purpose of this module is the visualization of point clouds in the ODM format. The main features of opalsView are:

  • simultaneuos visualization of multiple point clouds
  • independent visualization parameters (e.g. coloring or point size) for each point cloud
  • color coding of point clouds based on coordinates or point attributes
  • histogram of coordinates or point attributes
  • info tooltip for single points
  • export of high resolution images
  • visualization of normal vectors (if present in the ODM)
  • visualization of profiles
  • visualization of 3d shapefiles
  • visualization of DEMs in GeoTiff format
Figure 1: z-coded coloring of point cloud and point attributes from data cursor.

Data cursor

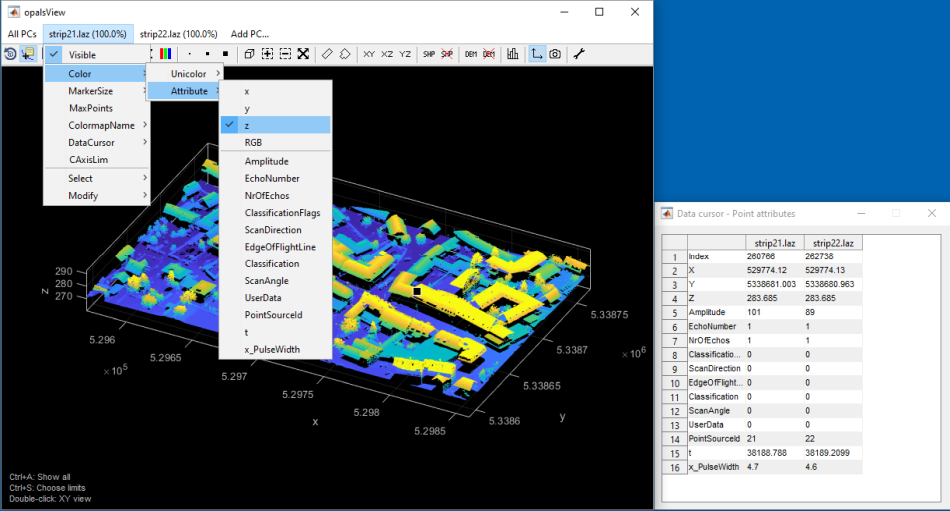
The data cursor (second icon in the toolbar) can be used to show and compare point attributes of multiple point clouds. If a point is selected in the point cloud, the corresponding attributes are displayed in a new window. The attributes to be analysed, can be selected in DataCursor -> Select attributes. To show or hide point clouds in the attribute table click DataCursor -> Show PC attributes. If multiple point clouds are opened, points can be compared by allowing a snap radius, which can be specified in the Options dialog.

Parameter description

-inFileinput files
Type: opals::Vector<opals::Path>
Remarks: mandatory
The specified input file while be loaded into the viewer
-filtermodify the input using a (tree of) filter(s)
Type: opals::String
Remarks: optional
A filter string in EBNF syntax as described in section 'Filter syntax' can be passed to restrict the input data set (e.g. to consider last echoes only)

Examples

The data used in the following examples can be found in the $OPALS_ROOT/demo/ directory.

Visualization of multiple point clouds

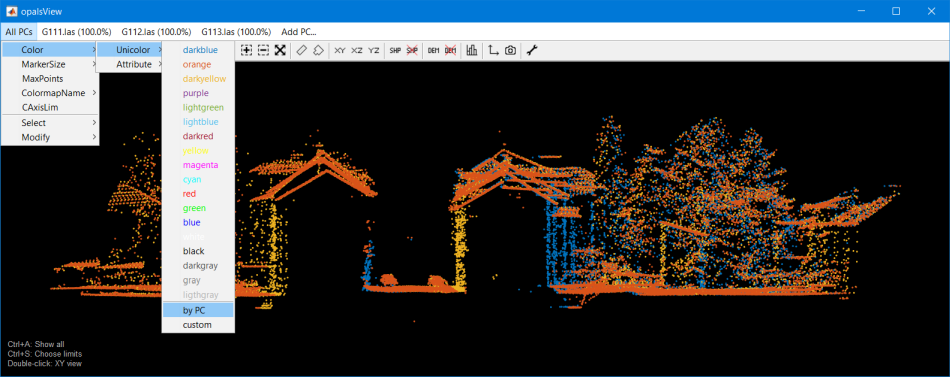
In this example three ALS strips are visualized using opalsView. As a first step, we have to import the strips, which are given in las format, using Module Import :

opalsImport -inFile G111.las -outFile G111.odm
opalsImport -inFile G112.las -outFile G112.odm
opalsImport -inFile G113.las -outFile G113.odm

Now opalsView can be called:

opalsView -inFile G111.odm G112.odm G113.odm
Figure 2: Visualization of multiple point clouds.

Visualization of normal vectors and histogram

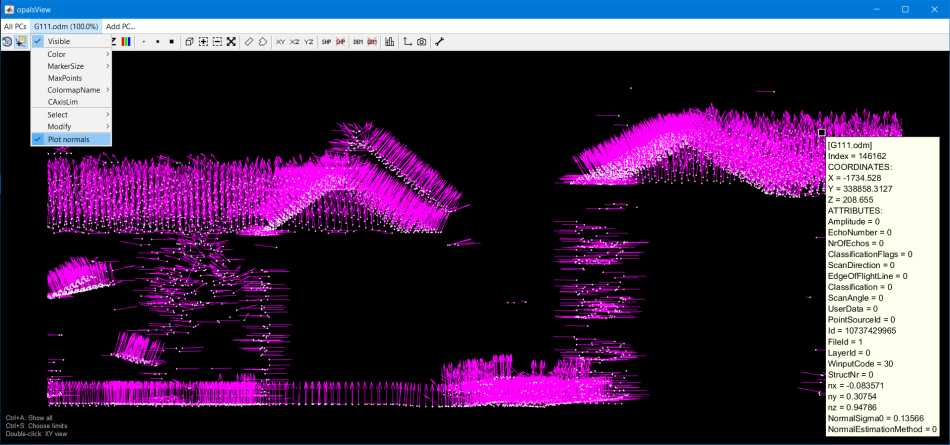
If the ODM file contains informations about the normal vectors, they can be visualized with opalsView. First, let's import the point cloud and estimate the normal vectors:

opalsImport -inFile G111.las -outFile G111.odm
opalsNormals -inFile G111.odm

Now opalsView can be called to visualize the point cloud together with the normal vectors:

opalsView -inFile G111.odm
Figure 3: Visualization of normal vectors.

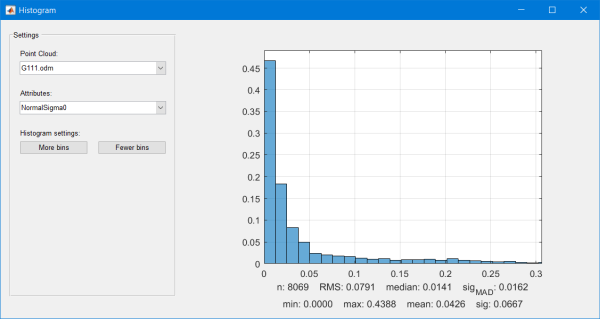
Coloring and lenght of the normal vectors can be adjusted in the options. A histogram of the currently displayed points can be opened with the histogram button in the toolbar of opalsView:

Figure 4: Histogram of NormalSigma0.

Visualization of DEM

In opalsView a DEM (in GeoTiff format) can be visualized together with the point clouds. First, the DEM is estimated using Module Grid :

opalsImport -inFile G111.las -outFile G111.odm
opalsGrid -inFile G111.odm -interpolation movingPlanes

After opening the file in opalsView, the DEM can be added with the "DEM" button in the toolbar:

opalsView -inFile G111.odm
Figure 5: DEM visualization.

References

Author
pg, jo
Date
13.3.2017
opalsNormals is the executable file of Module Normals
Definition: ModuleExecutables.hpp:148
@ movingPlanes
moving (tilted) plane interpolation
opalsImport is the executable file of Module Import
Definition: ModuleExecutables.hpp:113
opalsView is the executable file of Module View
Definition: ModuleExecutables.hpp:248
opalsGrid is the executable file of Module Grid
Definition: ModuleExecutables.hpp:93