Technische Universität Wien
Orientation and Processing of Airborne Laser Scanning data
Department of Geodesy and Geoinformation - Research Groups Photogrammetry and Remote Sensing
When working with bathymetric laser scanning data (ALB), the interaction of the laser beam with the water body, including the boundary between water and air, has to be considered. The opalsSnellius modules deals with the physical basis and is able to correct a point cloud for the effects of refraction and speed of light in water. For this, a model of the water surface is required, which can be created in qpals qpals. It can be started by navigating to qpals-WaterSurfaceModeler in the QGIS menu bar.
The graphical user interface of the water surface modeler is pictured below. In the background, the main window of QGIS is show, where the red section depicts the currently loaded one and the green sections represent confirmed sections. The remaining sections are colored in blue.
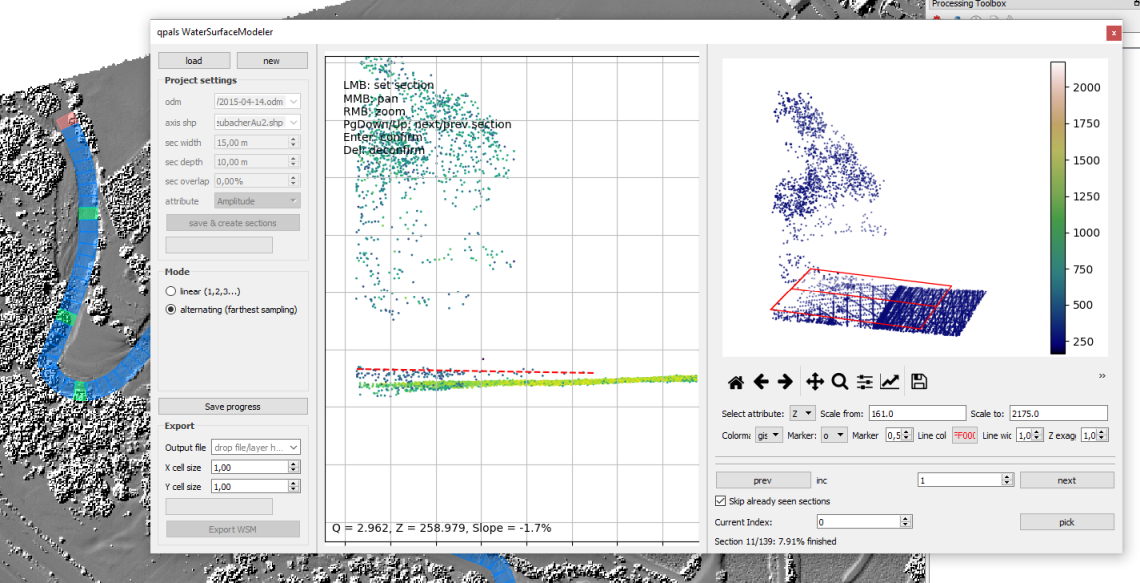
The input required to the qpals Water Surface Modeler is a point cloud (in odm format) and a river axis (as a Line-Shapefile). Additionally, it is suggested to visualize the odm in QGIS using the qpals Visualizer. For example, a shading with a cell size of 1m is an appropriate visualization for medium-size input datasets.
To start a new project, press the "new" button on the top left of the qpals WaterSurfaceModeler. After specifying the point cloud (odm) and the axis (Shapefile), estimate the maximum river width in "sec width". "sec depth" is the along-axis dimension of each individual section and should be large enough so that the water surface can correctly be identified in the point cloud. "sec overlap" specifies the overlap of two consecutive sections. Finally, an attribute used for visualization can be selected. Click "save & create sections" to start the section calculation. This may take a while, but the results will be saved in a *.qpalsWSM-File for the future. Whenever new water levels are added, they can be saved to the file by clicking "Save Progress".
The detection and modelling of the water surface is done on a per-section base. Some information on the current section can be found in the lower right part of the user interface. Every section is part of the following groups:
All sections are assigned (1) at the beginning. Once a section has been shown to the user, it switches to (2). If a water surface is confirmed by pressing the [Enter]-Key, the state is switched to (3). Only sections that are part of group (3) are used for the interpolation of the final model.
To aid in water surface identification, it is suggested to use the "alternating" workflow. This ensures that the "next" section (by pressing the [Page Down]-Key) is the one that is furthest away from the previously seen ones. By unchecking "Skip already seen sections", this can be changed to only consider sections that have been confirmed. Alternatively, the linear workflow allows walking through the axis one section after another. By changing the value of the "inc" field on the right hand side, a fixed number of sections can be skipped by walking through.
If an unseen section is shown for the first time, the water surface is estimated by inverse distance interpolation in the axis-coordinate system. This should only be seen as a rough estimate and a guide for finding the water surface. The accuracy of this interpolation will increase with the number of sections that have been set and confirmed.
To set a water surface in a section, click and drag in the center plot. The result is reflected in the 3D-Plot on the top right immediately. The center plot will also give information about the coordinates of the clicked points and the slope (across) of the current section. The 3D-Plot has additional options equivalent to qpalsSection.
To select a section from the overview in the QGIS main window, use the "pick" tool, which can be activated on the bottom right of the user interface, and then click on the section to edit.
Additional commands are listed in the top right corner of the center plot.
After enough sections have been set to achieve the required accuracy, the result can be exported as a .tif-File representing the water surface. For this, insert a file name into the "Output file" box, and set X and Y cell sizes. A click on "Export" will start the export of the water surface model according to Mandlburger (2006), which may take some time. The progress bar gives a rough estimate of the current status.
Mandlburger, G. (2006). Topographische Modelle für Anwendungen in Hydraulik und Hydrologie.
 1.8.17