- See also
- opals::IZonalFit
Aim of module
Fits geometry models to a set of data points for multiple regions-of-interest.
General description
Laser scanning, image matching, and similar capturing techniques result in point clouds describing surfaces rather than single spots of interest. In certain regions the surface geometry is known a-priori. This applies to horizontal areas (e.g. car parks, football fields), tilted planes (e.g. single roof faces, artificial dams, etc.) or simple curved surfaces (e.g. cylindrical or hyperbolic roofs). One of the questions at hand is how well the point cloud can approximate these surfaces. The (mean) deviation of the points w.r.t. a best fitting geometry model can be considered a measure for the quality of the point cloud. Therefore, the aim of the module ZonalFit is to compute the best fitting geometry model by least squares adjustment for each region, to calculate the deviations (residuals) for the individual data points and to return, both, the parameters of the geometries and statistics of the deviations like mean, median, standard deviation, histograms, etc.
The main input is the point cloud (inFile) and a set of areas-of-interest (aoi). The input can either be
-
an original unstructured point cloud stored in an OPALS Data Manager (ODM) or
-
a regular raster stored in a GDAL supported format.
The interest zones can be specified ...
The perimeter of each interest zone can either be specified as a 2D (multi) polygon or as 2D/3D point. In the latter case, additional parameters are required defining the neighbourhood; i.e. the number of nearest neighbours (neighbours), the maximum search radius (searchRadius) as well as the search dimension (searchMode) and the selection mode (selMode). Please note, that these parameters are only necessary when interest areas are defined via points. They will be silently ignored when the zones are provided as (2D) polygons. For the subsequent surface fit all points within the specified perimeter are considered. Additionally, a filter can be used to consider only those points meeting certain selection criteria (filter).
For each zone the following processing steps are carried out:
-
The point cloud is queried from the input dataset (ODM or raster)
-
The queried points are used to fit a user defined geometry model (geometryModel). The available geometry models are: mean, plane, or quadric (i.e. zero order, first order, or second order polynomial surface) which can either be estimated in a strict least squares sense or using robust estimation to deactivate outliers.
-
For each successful zonal fit, the residuals are computed for all contributing data points and a histogram of the deviations is derived together with standard statistical parameters (min, max, mean, median, standard deviation, etc.)
-
Both, the parameters of the best fitting surfaces and the statistics of the residuals are provided as output parameters (outGeometry and statistics). The results can either be written to a parameter xml file (outParamFile) in the command line version of the module or be directly queried when used within a Python and/or C++ program via the respective get-functions.
-
In case a plot file name is specified (plotFile), the histograms of the residuals are additionally output in graphical for as Scalable Vector Graphics (SVG) files.
In case that the user define the option storeStatistics the values of these parameter(s) will be stored as attribute in the Area Of Interest file in case that the AOI file is an ODM file. In case that the AOI file is a shape file or a WKT string the program will throw an exception. Using the storeStatistics the module will store the defined value(s) as an attribute for each different geometry of the AOI file. Using this parameter gives the opportunity to user to store the statistics of the input geometries in the point cloud. In Example 3 there is the process to convert a .shp file to and odm file and then use it as area of interest.
Parameter description
-inFileinput grid or point cloud file (ODM)
Type:
opals::Path
Remarks: mandatory
The specified grid or ODM file is the basic input and provides the 3D points for fitting certain geometry models (cf. -geometryModel)
-attributeattribute to be used for fit,
Type:
opals::String
Remarks: default=z
By, default, the x-y-z-coordinates are used for the geometry model fit. Alternatively, any other ODM attribute can be used instead of z.
-aoiarea of interest,
Type:
opals::String
Remarks: optional
The areas-of-interest can be specified as a WKT string, a line or point shape file name, or an ODM file, respectively. In case the AOI is provided as an ODM file, the fitting results are stored as additional attributes in the ODM.
-filterfilter string
Type:
opals::String
Remarks: optional
A filter string in generic filter (EBNF) syntax can be provided to sub-select the ODM geometries which should be used as area of interest
-plotFilebase name of histogram plot files
Type:
opals::String
Remarks: optional
Specify the base name of histogram plot files. Additional file name postfixes are added automatically for each AOI.
-binWidthwidth of a single histogram bin (class)
Type: double
Remarks: optional
If specified, the histogram is divided into equidistant classes (bins) of the given interval
-sampleRangehistogram sample range (min max)
Type:
opals::Array<double, 2>
Remarks: optional
Range (min max) of sample (attribute) values considered for histogram calculation denoting the outermost bounds (i.e.: min=lower bound of first class, max=upper bound of last class. Additionally, under/overflow classes are provided to collect all samples outside the valid range. If not specified, the entire sample range of the specified ODM attribute or grid model is used.
-densityRangehistogram density range [%] (min max)
Type:
opals::Array<double, 2>
Remarks: optional
By default, the y-scale of the histogram, i.e. density [%], is derived automatically based on the maximum density class. A fixed density range can be forced by specifying -denityRange with a lower and upper bound (min,max). This is especially convenient for a visual comparison of multiple histogram plots.
-outGeometryoutGeometry
-limitdata limit window: left lower right upper
Type:
opals::Array<double, 4>
Remarks: optional
If specified, only data within the given window area (left lower right upper) are considered for processing.
-histogramgeneric histogram output object
Type:
opals::Vector<
opals::HistoStats>
Remarks: output
The results of a histogram calculation are provided as a generic object containing statistical information like: min, max, mean, median..., and the histogram classes each containing its relative frequency. Specify -outParamFile in order to store these results to an XML file.
-geometryModelgeometry model
Type:
opals::GeomModel
Remarks: default=plane
Specifies the functional model for the fit
-neighboursnearest neighbour count
Type: int32
Remarks: default=12
In case the (3D) points are used as AOIs for deriving local surface or attribute statistics, the specified number of neighbouring points are used for the model fit. Please note that, if the AOIs are speficied as polygons this paraemter is ignored.
-searchRadiusmaximum search distance
Type:
opals::Vector<float>
Remarks: default=5
In case the (3D) points are used as AOIs for deriving the local attribute statistics of a point, the maximum search distance is restricted by parameter -searchRadius. Depending on the chosen data selection mode (-selModel, cf. below), 1-3 values are accepted:
d2 ..... radius of infinite vertical search cylinder
d3 ..... radius of search sphere
d2.5 ... radius of counded cylinder, relative distance of cylinder bottom and top
If only one value is specified in 2.5D selection mode, the total cylinder height equals 2*radius. If two values are specified, the second value specifies half of the total cylinder height and a symmetrical search cylinder around the AOI data point is used.
-searchModedimension of nearest neighbor search
Type:
opals::SearchMode
Remarks: default=d2
Defines if 2D (infinite cylinder), 2.5D (bounded cylinder) or 3D (sphere) distances should be used for the neighbour search.
-selModedata selection mode
Type:
opals::SelectionMode
Remarks: default=nearest
Please note that quadrant or octant wise data selection on the one hand reduces extrapolation effects, but on the other hand decreases the processing performance
-storeStatisticsFeature Selection Mode
Type:
opals::Vector<
DM::StatFeature>
Remarks: optional
This option defines which statistics should be stored as attributes in the AOI or ODM file, respectively, Available statics are: min,max,median,mean,sigmaMad,rms].
-byproductfit points datamanager file
Type:
opals::Path
Remarks: optional
This optional datamanager output can be used to further visualize or analyse all points that have been used for the model fit.
Examples
The data used in the subsequent examples are located in the $OPALS_ROOT/demo/ directory and the following preprocessing steps (data import, surface grid and difference model calculation) are required:
Example 1: Zonal Fit using shape file filled with user defined polygons
opalsZonalFit -inFile strip21.odm -aoi ZonalFitPolygonTest.shp -geometryModel Plane -
plotFile plnPoly.svg
This example geta as input an ODM file and an SHP (ESRI Shape) file and creates a histogram and a plotfile as output for each polygon of the SHP file. In this example for each polygon a best fitting tilted plane is estimated. For each successful fit the residuals are computed for all contributing data points and a histogram of the deviations is derived together with standard statistical parameters. If the (optional) option plotFile is specified, the histograms of the residuals are additionally output as a SVG file. The following image shows the polygons included in area of interest (ZonalFitPolygonTest.shp) for which the planes are estimated based on the laser points (strip21.odm). The input contains 14 polygons.
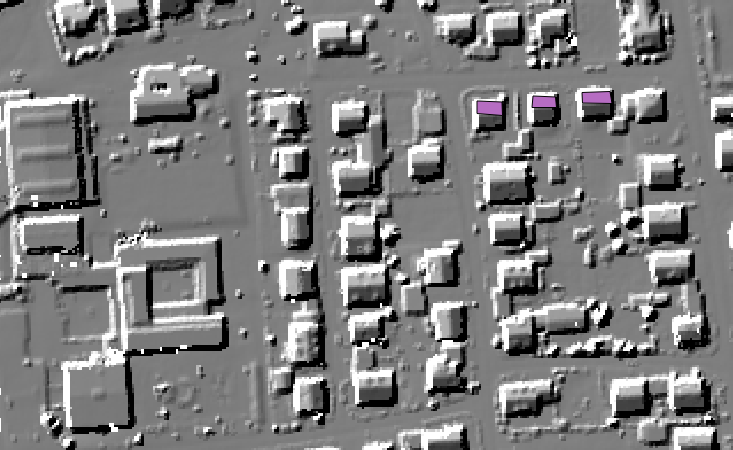
Visual presentation of Zonal Fit functionality
The following histograms are the output of the example above. The following histograms shows the histogram of the residuals of the corresponding polygon.
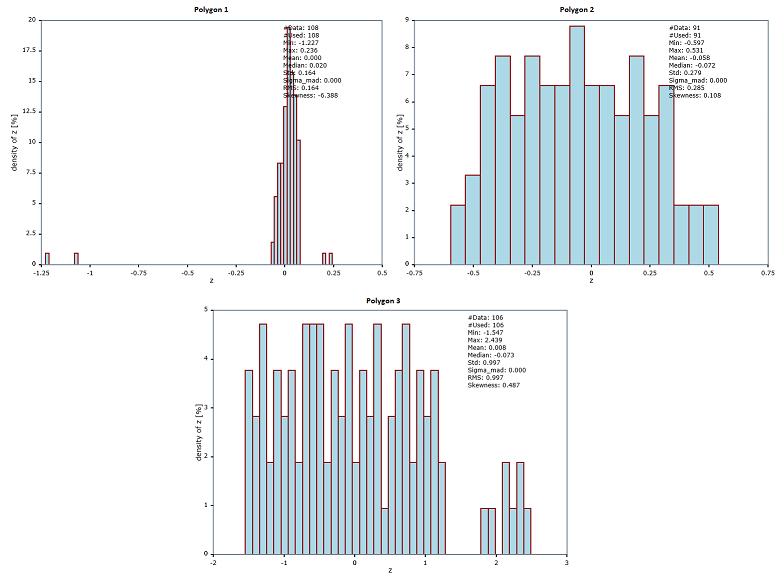
Histogram of the residuals for polygon 12
Example 2: Zonal Fit using shape file filled with user defined points
In this example the interrested area (aoi) is defined by points. Additional parameters are required. In this case predefined values are used. See parameters section for default values.
Running the command
The following screenshot shows that the area of interest (aoi) in this example consists of ten points and the geometry. Again a tilted plane is used as geometry model.
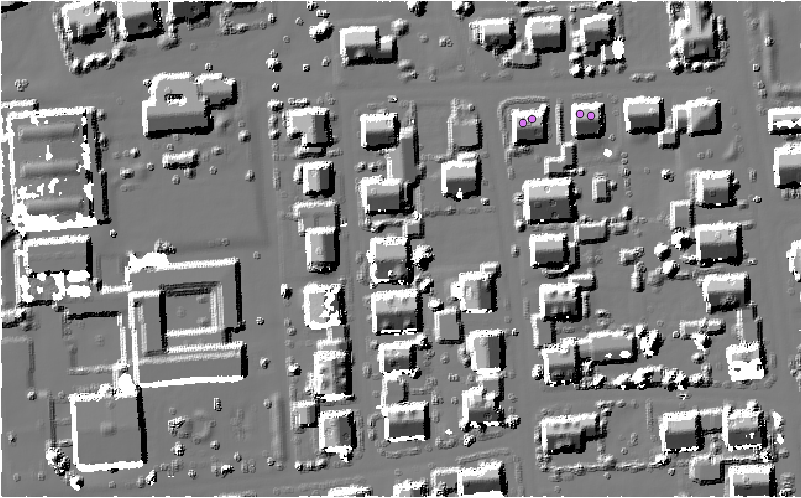
Zonal Fit using points as Area of Interest
Example 3: Zonal Fit using ODM file as aoi filled with user defined polygons
In the example above the ZonalFitPolygonTest.shp file is imported into an ODM file (ZonalFitPolygonTest.odm). The Module ZonalFit uses this ODM file as an Area Of Interest and storea the min max and median as additional attributes for each of the 14 polygons. Using the module opalsInfo the following results will be presented :
Attribute Type  Count   min      max     mean    sigma
--------- ----  -----   -----    -----   -----   -----
_min        float   14      -1.262  -0.037  -0.142   0.323
_max        float   14       0.040   0.117   0.068   0.027
_median     float   14      -0.002   0.009   0.001   0.003
- Author
- KLouka, GM
- Date
- 26.05.2016
 1.8.17