Technische Universität Wien
Orientation and Processing of Airborne Laser Scanning data
Department of Geodesy and Geoinformation - Research Groups Photogrammetry and Remote Sensing
Extracts and reports information of an ODM, vector or raster file.
opalsInfo extracts statistic information (number of points/lines/polygons, the bounding box, attribute information, spatial index details, etc..) from a data set input file. The information provided in the header of the file format is made available through a generic file statistics object. Since not all data formats provide full statistic with the header, the module also provides an exact computation mode. In this mode not only the header, but the full content of the input file is read through allow extracting complete statistic information. Please note that the exact computation mode is typically much slower than the standard mode but it will report correct informations even in cases where the header information is incomplete or incorrect.
Beside standard statistic values (min, max, mean and stdDev) it is possible to retrieve value frequencies of requested attributes for ODM and vector files. Whereas standard statistics might be extractable from the file header, value frequency determination require a complete read through of the input file. So for huge files this can take some time. Value frequencies are not restricted to integer attributes, but are currently limited to 1000 distinct values. As shown in example 3 the feature can be used to get the distribution of e.g. the classification values.
To get a quick visual overview of a vector data set, the export overview feature of Module Info can be used. Whereas for ODM files the overview rasters are directly accessible within the file header (they are incrementally updated during import), other vector format require a complete read through for generating the corresponding height and/or point count raster. Internally the same code for ODM and vector files are used, which is why the raster will be same if created from the original vector file or from the corresponding imported ODM as it is demonstrated in example 4.
Besides the derivation of different statistical information Module Info can be used to generate OPALS Format Definition (OFD) files. Those XML files basically describe the format, the attributes and what of the data should be imported or exported. Based on a given input file (ODM or vector format) the module creates an specific OFD file for a specific vector format. Currently, the formats las, rdb and shape are supported (The generic text and binary OFD are not supported, since those file do not contain any header information). When providing an input file of one of the aforementioned formats the OFD file is automatically created for this target format (if not defined differently). If an ODM is given as inFile the user needs to explicitly specify the target format by the generateOFD.format parameter or a las OFD file is created. The generated OFD file also included some XML comments which should support the user in adapting the file. The created OFD file contains all attribute entries based on the given input files, since it is easier to delete irrelevant entries than adding missing ones. For completeness it is mentioned that especially the Riegl RDB format definition might required some adoptions depending on the usage context (e.g. in Module Translate). See Example 5: Generation of an OPALS Format Definition for further details.
The data used in the following example are located in the $OPALS_ROOT/demo/ directory. The example shows how to use opalsInfo to get an overview about data (including their attributes) within an odm.
As a prerequisite, the ALS point cloud data must be imported into the ODM. To achieve that, change to the demo directory and type:
Now, run the following command
which gives the following output:
After a generic information block the section about the data set attributes is listed. Figure 1 captures the corresponding section from the log file.
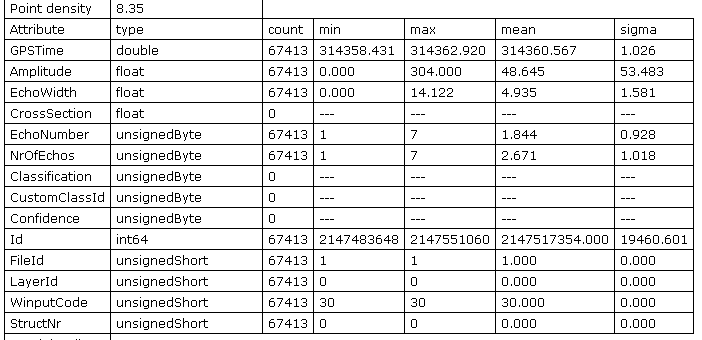
fullwave.fwfA special feature of the ODM is the on-the-fly collection of statistical information of all attributes. A useful feature for checking the correctness of imported or processed data. The last five attributes (Id, FileId, LayerId, WinputCode and StructNr) are "virtual" attributes. They exist for internally reason, however, are not made persistent on disk.
With the following command
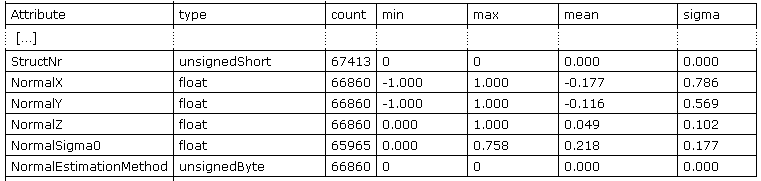
local planes are estimated within each point of the data set. In the current example the computation succeeds for 67297 points (and fails in 116 cases). Running opalsInfo again
will show the newly added attributes (c.f. Figure 2). The statistics also reflect the number of successful computated plane estimations (For NormalSigma0 even less values have been set, since redundancy is required for its computation).
The last section of the module output covers information of the spatial index (c.f. Figure 3). The spatial index statistics is also reported after importing a data set, since it is crucial for processing the ODM. For further details please refer to section Analysing the index statistics of an ODM.

When running Module Info within a Python script, direct access to the statistics of the dataset is provided via the OPALS Python API. This is exemplified in the sample script $OPALS_ROOT/demo/infoDemo.py:
To run the script, type:
The script imports the dataset strip11.laz and queries the attribute and spatial index statistics. This is achieved by accessing the statistic parameter provided by Module Info. The script uses the access function of the complex Python type opals::DataSetStats to query (and print) the respective values.
Beside the standard statistic measures like min, max, mean and standard deviation, the module also supports the determination of value frequencies of specified attributes. This is feature can be used e.g. to retrieve all classification values that exist within a dataset. The following command
outputs (after the standard attribute table) a value frequency table for the specified attributes:
Nodata values (or attributes that are marked as invalid) are printed in the first row and therefore also visible within the table. The value frequency is not limited to integer attributes, but the computation is currently restricted to 1000 unique values. If more than 1000 values exists, the frequency histogram is not further extended.
Using exportOverview one can export an height and/or point count overview raster of the input vector data set. The overview rasters will always have a resolution of 200-400 pixels in height and width independent of data set size, density and bounding box. The raster file(s) are always created at the same path location and with the same time stamp as the input file to exhibit their origin. It is possible to explicitly export the height raster, the point count raster, or both. The raster file names are post-fixed with _overview_z and _overview_pcount if not the multiBand flag is activated. In this case both raster are written as two bands into one file that post-fixed _overview only.
Whereas vector formats need to be read through for exporting overview rasters, this is not the case for ODM files. Since this overview information is always created during import and stored within the ODM header, writing the overview raster does not required reading any ODM geometry objects. Hence, export runs very fast but of course the source vector file needs to be imported first as shown below.
In both cases, the same code/algorithm is use which results in the exact same overview raster files. For completeness, it should be mentioned that overview files are also used in some workflow scripts for informational purposes (e.g. Python script preDataCheck) or for speeding up processing (e.g. Python script preCutting).

When importing data into OPALS usually all information provided by the data set file is preserved. Using OFD files the imported (or exported) information can be controlled, i.e. attributes can be excluded or renamed during io operations. The demo strip laz files contain an extra byte attribute named PulseWidth. For skipping this extra byte attribute during import the following command can be used to create strip_ofd.xml file.
The created files looks like
By simply removing (or commenting out) the corresponding extraBytes line and using the OFD file during import, the extra byte attribute PulseWidth will be skipped.
To check the absence of the PulseWidth attribute use Module Info (as shown above) to inspect the attribute table:

strip11.laz excluding PulseWidth The OFD creation functionality is even more relevant for exporting data. OPALS is a powerful and flexible tool in extracting, computing and storing of new attributes. In the following example surface normals are computed. Beside the normal vector components also the sigma0 of the adjustemnt is estimated and stored as attribute NormalSigma0. This information can be interpreted as surface roughness and might be relevant for exporting into a las file. Therefore, we create an OFD file using the generateOFD.file feature which includes all attributes that are stored within the ODM.
Since we are only interested in the surface roughness we disable/remove all other extra byte entries and set the las name to Roughness (also see $OPALS_ROOT/demo/las_with_roughness.xml)
The final las file is then created by the following export command
As it can be seen during export the extra bytes Roughness is written
or use a Module Info run to check for the existence of the extra bytes
at the end of the attribute table:
As mentioned above, the OFD creation functionality can be used for rdb and shape files in a similar way.
Like various other modules Module Info also supports multi file input which was introduced to serve two purposes:
In case of the standard (non-merged) mode for each file a separate statistics object is provided. Please note that no statistics objects will be provided if an error occurred for any of the specified files. This might be an unwanted behavior and can be changed by activating the enduranceMode mode. In this mode it is secured that all files are read and possible file reading errors are stored in the corresponding dataset statistics object (see ErrorMessage function of class opals::DataSetStats). Since the multi input file case is mainly relevant for python scripts, this feature is demonstrated by the following script
To run the script, type the following command in the $OPALS_ROOT/demo/ directory:
 1.8.17