- See also
- opals::IPointStats
Aim of module
Derives and stores statistical parameters describing the local distribution of a point attribute for each point of an ODM.
General description
The aim of opalsPointStats is to scan a point cloud stored in an ODM file (inFile) and to analyze the distribution of a selected point attribute (attribute) within a local neighbourhood (searchRadius). The derived statistical measures (feature) are stored as additional attributes of the current point. The module computes one or more statistical features within a single run. The point neighbourhood can be defined in 2D, 2.5D or 3D (searchMode), i.e., points are selected within a infinite vertical cylinder (2D), a finite vertical cylinder (2.5D) or a sphere (3D). For details on how to define the shape of the query cylinder please refer to parameter searchRadius.
The selected statistical features are calculated by aggregating the signed attribute deviations of the feature point and its neighbours from a reference model (refModel). The following reference models are supported:
-
zeroPlane: Whereas the three other reference models deliver 'relative' values, this models aggregates the 'absolute' attribute values. Hence, this reference model is often used to derive features like min, max, mean, median, minority and majority. Attention: Please note that this reference model is NOT the default model (see reference model horizontalPlane)
-
horizontalPlane (default): The vertical attribute deviations w.r.t the attribute of the feature point are aggregated.
-
tiltedPlane: The tilted plane mode is only available for elevations (i.e., attribute=z). In this case, the orthogonal distance w.r.t a local surface tangent plane passing through the feature point are aggregated. The module uses existing local normal information (NormalX, NormalY, NormalZ; see Module Normals) for tilting the local plane. Considering the local slope helps to distinguish, e.g.,
low vegetation areas from smoothly sloped regions. However, the tilted plane is only used if the standard deviation of the plane fitting (sigma) is below the given threshold (maxSigma). Otherwise the module drops back to the horizontal plane model. Please note that the orientation of normal vector is relevant to the computation in case of slope adaption. Positive distances are computed for points within the positive half-space of the normal vector. The other half-space will result in negative distances. Thus, the horizontal plane mode is a special case of the more generic tilted plane with a fixed normal vector of (0|0|1).
-
grid file: In this case, the vertical deviations to a grid/raster model are aggregated. The raster must be provided in GDAL readable format (gridFile).
Currently, the following statistical features are supported (also see opals::StatFeature::Type for further details):
-
min: lowest value
-
max: highest value
-
range: highest minus lowest value
-
nmin: n-th lowest value
-
nmax: n-th highest value
-
mean: mean (average) of all values
-
sum: sum of all values
-
median: median of all values
-
rms: root mean square of all values
-
variance: (sample) variance of all values
-
stdDev: standard deviation of all values
-
stdDevMAD: robust standard deviation estimator computed from the median of absolute deviations from the median of all values
-
pdens: ratio of point count within neighbourhood and the area/volume of search cylinder/sphere
-
pcount: point count within neighbourhood
-
rank: relative position (0..100) of the feature point within its vertical neighbourhood (0 if the feature point value is the local minimum and 100 if it is the local maximum)
-
quantile: p-quantile (p=0..1)
-
posOpenness: positive openness of all values
-
negOpenness: negative openness of all values
-
minority: returns the minority value for a given bin width (e.g. minority:4 -> bin width is set to 4. default bin width is 1)
-
majority: returns the majority value for a given bin width
-
shannonEntropy: returns the shannon entropy value for a given bin width
-
quadraticEntropy: returns the quadratic entropy value for a given bin width
-
pdist: average linear point distance (see DM::ILinearDistance2D for details)
Consequently, features like min and max represent relative rather than absolute values, and therefore, cannot be directly compared with the point attribute values (c.f. Figure 1)
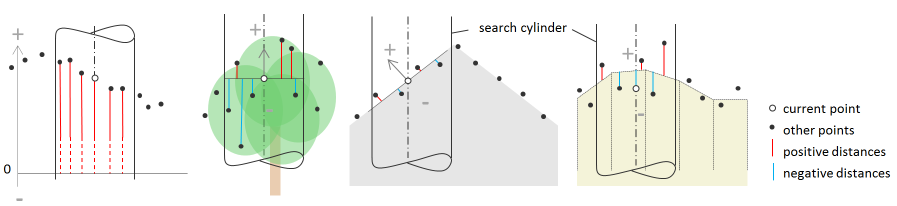
Fig. 1: Reference models (from left to right): zero plane, horizontal plane, tilted plane, and grid file for 2d search
Attribute storage schema
The computed statistical features are stored as user-defined attributes (see ODM as a database table) within the current ODM using a fixed attribute naming schema. For the zeroPlane reference model the attribute is composed of _ + attribute name + feature name, whereas for the other reference models _d is used as prefix indicating the relative nature (d for difference) of these statistical values. Both, the attribute and feature name start with a capital letter. A few examples are listed below:
-
Reference model zeroPlane
-
_ZMax: attribute=z, feature=max (highest value)
-
_ZMedian: attribute=z, feature=median (median value)
-
_ClassificationMajority: attribute=classification, feature=majority
-
Reference models horizontalPlane, tiltedPlane and for grid file
-
_dZVariance: attribute=z, feature=variance (a local roughness measure)
-
_dZRank: attribute=z, feature=rank (relative vertical position in percent in the corresponding neighbourhood)
-
_dAmplitudeQ0.20: attribute=amplitude, feature=q0.2 (20% amplitude quantile)
Please note that running Module PointStats multiple time with the same attribute/feature combination but with different filters will not change the name of the derived ODM feature and, thus, overwrite the existing feature. User Module AddInfo in this case to copy/backup previously calculated attributes.
Parameter description
-inFileODM input file
Type:
opals::Path
Remarks: mandatory
The points of the specified ODM file are used for local statistical analysis. For a selected attribute the computed features are appended to the points and stored wihtin the same ODM file.
-searchRadiussearch distance
Type:
opals::Vector<float>
Remarks: default=0
For deriving the local attribute statistics of a point, all points within the specified distance/query object are considered. Depending on parameter searchMode the size/shape of the search query object can be defined. Whereas infinite cylinder (d2) and sphere (d3) queries take a single search radius only, cylinder (d2_5) queries accept up to three distance values: radius of cylinder, dzmin (relative height of the cylinders bottom; usually negative value), dzmax (relative height of the cylinders' top). If only the cylinder radius is defined, dzmin is set to -radius and dzmax to radius. In case of two values, the cylinder radius is set to value(1), dzmin to -value(2) and dzmax to value(2).
-maxSigmamaximum tolerable sigma of plane fitting
Type: float
Remarks: default=0.3
This parameter applies when analyzing the local height distribution (attribute==z) in slope adaption mode (refModel=tiltedPlane). If the sigma (i.e.: standard deviation of the surface plane fit) is below the specified threshold, the signed distances to the tilted plane are used for computation. Otherwise the distances to a horizontal reference plane are used.
-searchModedimension of the point selection
Type:
opals::SearchMode
Remarks: default=d2
Feature computation searches data within a infinte cylinder (d2), a finite cylinder (d2_5) or a sphere (d3).
-attributeattribute for which statistical feature(s) are to be derived
Type:
opals::String
Remarks: default=z
Attribute examples: Z, Amplitude, EchoWidth, EchoRatio, etc. Naming convention for derived ODM attribute name: _(d)[attribute][feature], e.g. _dAmplitudeMax. Cf. general description for more details.
-featurestatistical feature(s) to be derived
Type:
opals::Vector<
DM::StatFeature>
Remarks: mandatory
One or more feature(s) of the set [min,max,range,nmin:n,nmax:n,mean,median,sum,rms,variance,stdDev,stdDevMAD,pdens,pdist,pcount,rank,quantile,posOpenness,negOpenness,minority,majority,shannonEntropy,quadraticEntropy] can be derived and stored as additional infos within each point.Naming convention for derived ODM attribute name: _(d)[attribute][feature], e.g. _dAmplitudeMax. Cf. general description for more details. Hint for use in Python: Speficy the features as list of strings, e.g. ['min','mean']
-filterfilter processing and spatial selected points
Type:
opals::Vector<
opals::String>
Remarks: optional
The first filter specifies for which points statistic values should be dervied. The secound filter reduces the search space of the spatial queries (if the second filter is not set, the same filter as value one is used).
-refModelreference model [zeroPlane|horizontalPlane|tiltedPlane|gridFile]
Type:
opals::String
Remarks: default=horizontalPlane
Defines the reference model for statistical feature computation. The samples are reduced w.r.t. a
zeroPlane......... plane passing through the origin
horizontalPlane... plane passing through the feature point
tiltedPlane....... plane perpendicular to surface normal vector, passing through the feature point
gridModel......... raster model in GDAL supported format.
-procModereal or integer processing mode
Type:
opals::HistoMode
Remarks: default=automatic
For features aggregated into bins like minority and majority, the bin center is used as representative value. The same applies to procMode=integer, where the bin limits are shifted by half the bin size so that the corresponding integer value is located in the bin center. With procMode=real the bin limits are mutiples of the bin sizes, which is suitable for processing features of floating point (real) type. In automatic mode the module selects real or integer procMode based on the attribute type.
-resamplinggrid resampling method.
Type:
opals::ResamplingMethod
Remarks: optional
Method to be used for resampling the input grids to the specified grid structure of the output grid. This option is only considered while using a grid file as reference model (see option refModel).
Examples
The data used in the following example are located in the $OPALS_ROOT/demo/ directory. In this example, the dataset fullwave.fwf containing full waveform ALS point data (x, y, z, gps time, amplitude, echo width, echo nr, echo qualifier) of a wooded area is used. First, the data have to be imported into the ODM.
Example 1:
In the first example only the mandatory parameters inFile, feature and searchRadius are specified. The following command computes and stores the local minimum values as _dZMin attribute
Using Module Info
the newly computed attribute can be inspected (on the screen or within the log file).
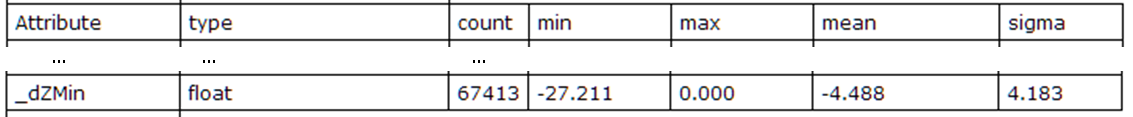
Fig. 2: Statistics of the computed local minimum feature
The attribute statistics clearly show that _dZMin is NOT an absolute (refModel=horizontalPlane), but a relative measure. If absolute values are required one can use refModel zeroPlane to compute this information.
As before, opalsInfo helps to check the computed results.
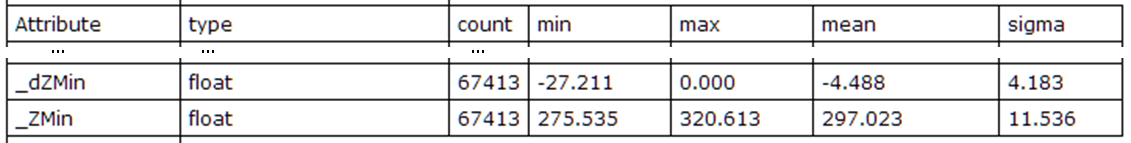
Fig. 3: Statistics of absolute and relative minimum feature
Example 2:
In general, opalsPointStats extracts point features that can be used for point classification. In the following example a simple strategy is shown to separate tree canopy points from the overall point cloud. LIDAR data of vegetated areas
typically show a significat height variation. High range values will reflect high vegetation. On the other hand, the rank feature describes the relative vertical position of a point. Therefore those two features are appropriate measures to classify vegetation.
The following command computes the two features for the given demo data set:
Making use of the new attributes within a filter, tree canopy points can be e.g. exported into a LAS file. The following command exports all points with a local hight spread of at least 5 [m] and a relative position withon the search sphere of more than 90% as tree canopy points into pts_canopy.las. By simply inverting the defined filter all other points are written to pts_rest.las:
opalsExport -infile fullwave.odm -outfile pts_canopy.las -
filter "generic[_dZRange>5 and _dZRank>90]"
opalsExport -infile fullwave.odm -outfile pts_rest.las -
filter "not generic[_dZRange>5 and _dZRank>90]"
Using an appropriate visualisation tool (e.g. FugroViewer) the result can be inspected as shown below
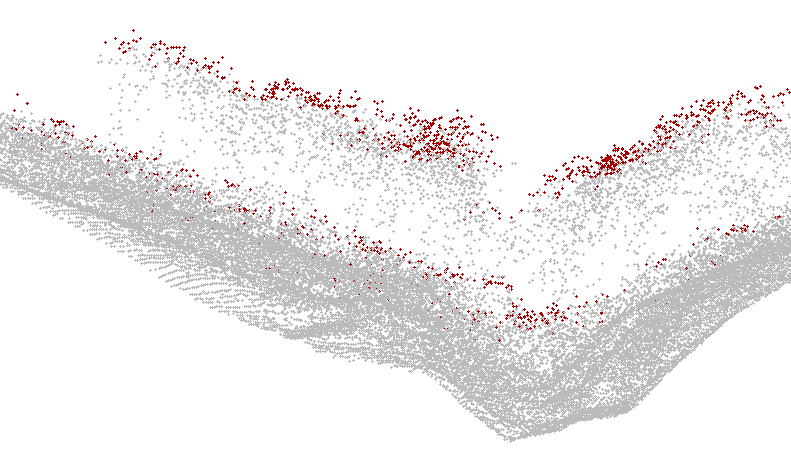
Fig. 4: Profile view of canopy points (red) and all other points (grey)
References
- Author
- jo, gm
- Date
- 14.07.2013
 1.8.17