- See also
- opals::ISection
Aim of module
Extracts sections of user defined width/length along a specified reference axis from a point cloud (ODM).
General description
Line oriented applications often require a section-wise inspection and/or treatment of the point cloud data. This is, e.g., typical for data processing of roads, railways, rivers, power lines, etc. In this case it is beneficial to extract the data in subsequent chunks of a certain width and depth following the path of the line axis and to visualize/analze them in the vertical (cross sectional) view.
The main input parameter for deriving sections are the OPALS datamanager file (inFile) containing the 3D point cloud and the reference axis (axisFile) perpendicular to which the individual (cross) sections are aligned. The reference axis might either be specified as a file in ESRI shapefile format or, alternatively, via two corners of the dataset (e.g. East-West-axis: axisFile=E-W). The width and length of the section can be specified with the parameter patchSize. The length denotes the dimension in axis direction and the width the dimension perpendicular to the axis. In general, the distance between consecutive sections is equal to the length of the sections, but an overlap value (0..1) can be defined (overlap). In the special case overlap=0, the sections are calculated for all vertices of the reference axis; in all other cases the section distance is calculated as length*overlap. By default, only the 3D point coordinates are stored but an optional point attribute can be considered (attribute). While the ODM constitutes the primary dataset it is also possible to store sections of one or more raster datasets (gridFile) along with the point cloud.
The section points are stored as Well-Known-Text (WKT) strings compliant to the OCC Simple Features Specification. The list of WKT-strings can be queried after a successful run of the module (outGeometry) from within a Python script or a C++ program. In addition, the results are stored in an output parameter XML file, if parameter (outParamFile) is specified.
Each section is provided as an OGC geometry collection consisting of:
-
LINESTRING: location and orientation (x-axis) of the local profile coordinate system (PRFCS)
-
POLYGON: boundary polygon of the entire section area
-
POINT: 2D point representing the origin of the local system in PRFCS
-
MULTIPOINT: section points in PRFCS (c0 s0 e0, c1 s1 e1 , ...) c=cross distance, s=stationing, e=elevation).
-
[MULTIPOINT: section points in PRFCS (c0 s0 a0, c1 s1 a1 , ...) c=cross distance, s=stationing, a=attribute).
-
[LINESTRING: section (line) points of 1st raster dataset]
-
[LINESTRING: section (line) points of 2nd raster dataset]
-
[LINESTRING: ...]
Here an example derived from the strip21.las dataset stored in the $OPALS_ROOT/demo/ directory (3D point cloud + point attrbute: Amplitude + raster DEM).
GEOMETRYCOLLECTION(
LINESTRING(529774.182 5338668.680,529773.917 5338667.716),
POLYGON((529773.965 5338669.777,529774.930 5338669.511, ...)),
POINT(0 3.500),
MULTIPOINT( 0.729 3.139 271.991, 0.100 3.053 271.975, ...),
MULTIPOINT( 0.729 3.139 67.000, 0.100 3.053 87.000, ...),
LINESTRING( -1.000 0.0 271.933, 0.000 0.0 271.926, ... ))
Parameter description
-inFileinput ODM file
Type:
opals::Path
Remarks: mandatory
File containing point cloud data, i.e. source for extracting section information.
-gridFilegrid model file
Type:
opals::Vector<
opals::Path>
Remarks: optional
A list of additional grid/raster files in GDAL supported format. For each section, the the respective grid values are interpolated along the center line of the section (i.e., x-axis of the local profile coordinate system). The point spacing hereby equals to the grid size.
-axisFileaxis file (ESRI Shapefile)
Type:
opals::Path
Remarks: mandatory
ESRI Shapefile containing reference axis. The sections are contructed perpendicular to the axis. The axis defines a sliding, local profile coordinate system (PRFCS). The origin of the PRJCS is located on the axis, the y-axis coincides with the tangent direction of axis at the origin point, and the x-axis is perpendicular to the y-axis (positive x to right of the origin). Alternatively, the axis can be defined via the bounding window corners. Syntax: [StartCorner]-[EndCorner]. Use compass directions for defining the corners. Example: N-S or NE-SW or ...
-sectionRangesection range (begin [end])
Type:
opals::Vector<double>
Remarks: optional
Two numerical values denoting the start and stop arc length along the axis. If omitted,the eintire length of the axis is processed. If only one value is specified, the sections are processed from here to the end of the axis. Negative values indicate disctances counted from the end of the axis.
-patchSizesection extents (width length)
Type:
opals::Array<double, 2>
Remarks: default=10 1
The dimension of the sections are defined by its width (1st value) and length(2nd value). The length denotes the dimension in axis direction and the width the dimension perpendicular to the axis.
-overlapoverlap of consecutive sections (<0.0..1.0]
Type: double
Remarks: default=0
Defines the overlap of consecutive sections in axis direction. The section distance is calculated as: section length * (1-overlap)
-attributeoptional name of attribute
Type:
opals::String
Remarks: optional
If not specified only the 3D point coordinates are output but, however, the name of an optional attribute column can be specified. In this case, an additional geometry containing cross distance/stationing/attribute-tuples are generated. Attribute examples: Amplitude, EchoWidth, GPSTime etc.
-tileSizenr of sections per tile
Type: uint32
Remarks: default=25
Data processing is organized in a tile-based way. Processing can be fastend by using larger tile sizes at the prize of a higher memory usage. Use smaller tile sizes in case of out-of-memory problems.
-outGeometrylist of section points
Type:
opals::Vector<
opals::String>
Remarks: output
Each section is returned as a geometry collection in WKT syntax compliant to the OGC Simple Feature Specification. The geometry collection consists of a (i) 2D line (LINESTRING) representing the x-axis of the local profile coordinate system (PRFCS) expressed in the superior coordinate system of the point cloud (PCLCS), (ii) a 2D polygon (POLYGON) containing the 2D-boundary of the section area in PCLCS, (iii) a 2D point representing the origin of local system in PRFCS (i.e., POINT(0 stationing), and the section points in PRFCS (MULTIPOINT(c0 s0 h0, c1 s1 h1, ...; c=cross distance, s=stationing, h=height).
-filtermodify the input using a (tree of) filter(s)
Type:
opals::String
Remarks: optional
A filter string in EBNF syntax as described in section 'Filter syntax' can be passed to restrict the set of input points (e.g. to consider last echoes only).
Examples
The data used in the subsequent examples are located in the $OPALS_ROOT/demo/ directory and the following preprocessing steps (data import and surface grid calculation) are required:
Example 1:
To extract the entire point cloud in sections of 20m width and 4m depth aligned at the axis stored in the ESRI shape file strip21_axis.shp type the following command:
The resulting output geometries of the sections (3D point cloud + amplitude, additional DEM model) are stored as a vector of OGC simple feature WKT strings in the xml file strip21_sec.xml.
Example 2:
In Python, however, the resulting geometries (outGeometry) can be accessed directly. The following code snippet of the $OPALS_ROOT/demo/sectionDemo.py Python script uses the same parameters as in the above example and directly reads the section points and creates a separate png plot file for each section.
2 from opals
import Section
6 from matplotlib
import pyplot
12 shpBaseName = dataset +
"_sec_outline"
13 shpF = [shpBaseName+
".shp",shpBaseName+
".shx",shpBaseName+
".dbf"]
15 sec = Section.Section()
16 sec.commons.screenLogLevel = opals.Types.LogLevel.error
17 sec.inFile = dataset +
".odm"
18 sec.axisFile = dataset +
"_axis.shp"
19 sec.patchSize = [60., 2]
23 print(
"Extracting and plotting cross sections...")
24 outGeo = sec.outGeometry
25 for i
in range(len(outGeo)):
26 geomColl=ogr.CreateGeometryFromWkt(outGeo[i])
27 secStat = geomColl.GetGeometryRef(2)
28 secPts = geomColl.GetGeometryRef(3)
29 stat_str =
"%.1f" % secStat.GetY()
30 fn = dataset +
"_sec_"+stat_str+
".png"
31 numPts = secPts.GetGeometryCount()
32 print(
"{} contains {:d} point(s).".format(fn, numPts))
35 for ii
in range(numPts):
36 pt=secPts.GetGeometryRef(ii)
40 fig.size_inches = (10., 5.)
43 pyplot.xlim([-30.,30.])
44 pyplot.ylim([270.,290.])
45 pyplot.title(dataset +
': Section ' + stat_str)
46 pyplot.xlabel(
'dist from axis')
47 pyplot.ylabel(
'height')
51 print(
"Create Shape File containing section oulines...")
52 for ii
in range(len(shpF)):
53 if os.path.exists(shpF[ii]):
55 driverName =
"ESRI Shapefile"
56 drv = ogr.GetDriverByName( driverName )
57 ds = drv.CreateDataSource( shpF[ii] )
58 lyr = ds.CreateLayer(
"sec_outline",
None, ogr.wkbPolygon )
59 field_defn = ogr.FieldDefn(
"Stationing", ogr.OFTString )
60 field_defn.SetWidth( 32 )
61 lyr.CreateField ( field_defn )
63 for i
in range(len(outGeo)):
64 geomColl=ogr.CreateGeometryFromWkt(outGeo[i])
65 secPoly = geomColl.GetGeometryRef(1)
66 secStat = geomColl.GetGeometryRef(2)
67 stat_str =
"%.1f" % secStat.GetY()
69 feat = ogr.Feature( lyr.GetLayerDefn())
70 feat.SetField(
"Stationing", stat_str )
71 feat.SetGeometry(secPoly)
72 lyr.CreateFeature(feat)
Calling the script...
... produces a series of png files as well as a shape file containing the section outlines. Figure 1 shows a superimposition of the DSM shading, the axis and the semi-transperent section outlines. The 2D scatter plot on the right contains all points of the section at arc length of 9.0 along the axis (stored in file strip21_sec_9.0.png).
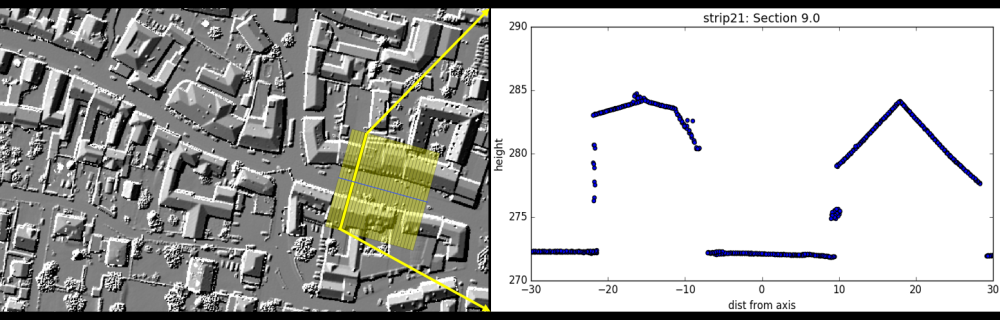
Figure 1: 2D scatter plot of point cloud at section 9.0
References
- Author
- GM
- Date
- 01.07.2016
 1.8.17