Technische Universität Wien
Orientation and Processing of Airborne Laser Scanning data
Department of Geodesy and Geoinformation - Research Groups Photogrammetry and Remote Sensing
As part of the opalsGeomorph package, a workflow and modules for the semi-automatic detection and extraction of terrain breaklines was developed. This workflow (c.f. Mandlburger et al. (2016)) is represented as a submodule of qpals in the form of a step-by-step wizard. It can be started by navigating to qpals-LineModeler in the QGIS menu bar.
Two different inputs are possible: A classified/filtered point cloud in any of the formats supported by opalsImport (e.g. las/laz, odm) or a digital terrain model (DTM). The terrain model should be free of any void areas. Depending on the input dataset, the terrain model will first be converted to a point cloud or vice-versa. Also, the terrain model itself and a shading will be added to the QGIS canvas.
For the breakline detection, a slope map is calculated from the DTM using opalsGridFeature. On this slope map, edge detection is carried out using the Canny (1986) algorithm. Two parameters of the opalsEdgeDetect module greatly influence the result:
We suggest playing aroung with the parameters a bit and trying out different combinations.
After the detection with opalsEdgeDetect, the breaklines are vectorized (opalsVectorize) and then cleaned topologically with a three-step approach in opalsLineTopology:
The parameters snapRadius and maxAngleDev in step two will have the most impact on the local line connections and the required manual labor in the next steps. The third step will mostly remove lines shorter than minLength.
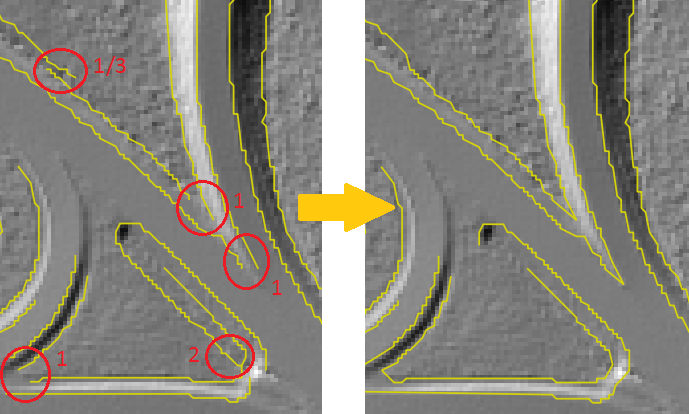
The pixel-based edge detection approach cannot fully recreate the 2D-detections required to correctly model the terrain breaklines. Especially in rough terrain, or where two or more breaklines are close to each other, errors might occur, which should be corrected. Since editing in 2D is much easier than in 3D, it is suggested to do this editing before the 3D Modelling. The following are typical cases where manual editing is suggested:
To help with the 2D-Editing, two tools are provided with qpalsLineModeler:
After editing, make sure to save any changes made to the layer.
This step contains the core modelling function. Using opalsLineModeler, the 2D approximations are modelled in 3D using the point cloud (or DTM). The processing might take some time, depending on the number of points and lines. No new lines will be added, but the approximations may be shortened and in turn eliminated due to short length, if the 3D intersection does not provide sufficient results. For parameter options and configuration, please refer to the documentation of opalsLineModeler.
After processing, two different validation/quality checks can be carried out:
The qpalsLineModeler contains a script to automatically check those issues. They may then be resolved by selecting the layer with the modelled lines and the "problems"-point layer. The following options are available for resolving:
Note that is not neccessary to correct all of the problems listed above. In some cases, the modelled lines might be correct, but they will still show up as a problem. It is up to the user to decide, which nodes/lines to keep and which ones to change.
After saving the changes, the result can be exported to a different location. The standard export format is ESRI Shapefile, however, Shapefiles cannot transport the full information created during the modelling process, such as segement-wise intersection properties (angle of intersection, surface types, ...). This information is stored in the temporary directory as an odm. It can be accessed e.g. using the Python Bindings of the OPALS Datamanager Library.
Canny, J., A Computational Approach To Edge Detection, IEEE Trans. Pattern Analysis and Machine Intelligence, 8(6):679–698, 1986.
G. Mandlburger, J. Otepka, C. Briese, W. Mücke, G. Summer, N. Pfeifer, S. Baltrusch, C. Dorn, H. Brockmann: Automatische Ableitung von Strukturlinien aus 3D-Punktwolken. in: Publikationen der Deutschen Gesellschaft für Photogrammetrie, Fernerkundung und Geoinformation e.V., Band 25 (2016), ISSN: 0942-2870; 131 - 142. 8(6):679–698, 1986.
 1.8.17