Module Cell
See also
opals::ICell

Aim of module

The aim of Module Cell is to derive raster models by accumulating selected features (min, max, mean, etc.) of a selected input data attribute (z, amplitude, echo width, etc.).

General description

Since ALS is a highly automated data capturing technique yielding an irregular point cloud, raster based data analysis is an important issue. Analyzing the data in regular raster structure is an established and convenient way to retrieve summary information about the data on a per cell basis. The following tasks can well be handled by raster analysis:

  • Point density: Raster models describing the data density can be derived by counting all points within the raster cells and dividing by the cell area. Point density models are an important tool for documenting the quality of ALS data capture.
  • Blunder detection: Raster models containing the minimum/maximum z-values of the input points per cell can be used for blunder detection (eg. long ranges due to multi-path effects or short ranges due to obstacles within the laser beam).
  • Average estimation: Coarse raster models containing averaged values (eg. the median or mean) are often useful to get a quick first overview about certain data features (simple height models ...). In this sense, rasterizing is a simple thinning strategy.
  • Roughness estimation: Raster models containing the local variability of data feaures can be derived by computing eg. the r.m.s of the input data. This information can be used for subsequent segmentation and/or classification tasks.

The main processing parameters of Module Cell are the list of features (parameter feature), for which raster models of a certain point attribute (parameter attribute) are to be derived. The OPALS Datamanager (ODM) is used as data base for deriving raster feature models. One of the outstanding properties of the ODM is that arbitrary point attributes (GPS time, amplitude, echo width ...) can be stored for each point along with the point coordinates (x,y,z). The default attribute is the point height (z), but raster feature models can also be generated for any of the available additional point attributes. For the derivation of a single raster pixel value, all points within the respective raster cell containing valid values for the selected attribute are queried from the ODM. The following cell operations (features) are supported:

  • min: lowest attribute value
  • max: highest attribute value
  • range: highest minus lowest attribute value
  • nmin: n-th lowest attribute value
  • nmax: n-th highest attribute value
  • mean: mean (average) of all attribute values
  • sum: sum of all attribute values
  • median: median of all attribute values
  • rms: root mean square of all attribute values
  • variance: (sample) variance of all attribute values
  • stdDev: standard deviation of all attribute values
  • stdDevMAD: robust standard deviation estimator computed from the median of absolute deviations from the median of all attribute values
  • minority: class with the lowest relative frequency (histogram based)
  • majority: class with the highest relative frequency (histogram based)
  • pdens: point density of all (valid) cell points
  • pcount: point count of all (valid) cell points
  • quantile: p-quantile (p=0..1)
  • shannonEntropy: shannon entropy with specifiable bin width, measure of information content
  • quadraticEntropy: quadratic entropy with specifiable bin width, measure of information content
  • center: select closest to cell center

The ODM administration of additional point attributes is highly extendable. Therefore, the list of possible attributes is only restricted by the availability of the respective information within the ODM. Section OPALS Datamanager contains a complete list of predefined ODM attributes.

The basic input for the raster model derivation is an ODM file (parameter inFile). Thus, the import of ALS point cloud data into the ODM is a prerequisite. Please refer to Module Import for more details concerning the import of ALS point cloud data. For each feature, the (aggregated) results are stored in separate raster files (parameter outFile) in GDAL supported data format (parameter oFormat). The raster derivation is organized in patches (tiles) internally, thus, maximum performance can be achieved for data formats supporting tile wise storage like GeoTiff or SCOP.RDH. The raster extents are either derived automatically based on the (xy-) extents of input data or can be specified by the user (parameter limit). Furthermore, the dimension of the raster cells (parameter cellSize) have to be specified. Optionally, a value indicating data voids (parameter noData) can be defined.

Beside raster files, also OPALS Data Managers (ODMs) may be generated as output files. In this case, the result of accumulation within each raster cell is not a single raster pixel value, but a single point. For the "selective" features (min, max, nmin, nmax, center), this is an original point with all its attributes; for the "aggregative" features (range, mean, median, rms, pdens, pcount, minority, majority, quantile, shannonEntropy, quadraticEntropy), this is a point just having 3 coordinates: x and y are given by the center of gravity of all points within the cell having a valid value for the selected attribute, whereas z is the respective attribute value as it is derived for a pixel in case of raster output files.

By default, the entire ODM contents are used as input data. However, in some cases it is useful to consider only a subset of the data, eg. to derive the point density for all last echoes. For this purpose, OPALS provides a general concept for filtering input data (parameter filter) by passing a Well-Known Text string (WKT). For a detailed description of the WKT filter syntax along with some illustrative examples, please refer to Section Filters.

Parameter description

-inFileinput data manager file name(s)
Type: opals::Vector<opals::Path>
Remarks: mandatory
The path(s) to the OPALS data manager(s) whose point data are used to derive the raster model(s) (or output OPALS data manager(s)). In case multiple ODMs are specified, the data are queried from all (potentially overlapping) ODMs.
-outFileoutput raster file name(s) (or output OPALS data manager(s))
Type: opals::Vector<opals::Path>
Remarks: estimable
Path(s) of the output raster file(s) in GDAL supported format (or output opals data managers)
Estimation rule: estimated from inFile, attribute, feature and oFormat in the current directory; in case of one given outFile but several features, the actual output files are estimated from outFile, feature, oFormat.
-oFormatgrid file format [GTiff,AAIGrid,USGSDEM,SCOP...] or opals data manager format [ODM]
Type: opals::String
Remarks: estimable
Use GDAL driver names like GTiff, AAIGrid, USGSDEM, SCOP... or ODM.
Estimation rule: the output format is estimated based on the extension of the output file (*.tif->GTiff, *.dem->USGSDEM, *.dtm->SCOP..., *.odm->ODM).
-cellSizecellwidth x/y
Type: opals::Vector<double>
Remarks: default=10 10
Size of the rectangular grid cell in x- and y-direction. If only one value is passed, quadratic cells are used.
-attributeattribute from which the features shall be derived
Type: opals::String
Remarks: default=z
Valid attributes are either coordinates (x, y, z) or additional infos like Amplitude, EchoWidth etc.)
-featureFeature(s) for which the raster model(s) (or opals data manager(s)) shall be derived
Type: opals::Vector<DM::StatFeature>
Remarks: mandatory
One or more feature(s) of the set [min,max,diff,nmin:n,nmax:n,mean,median,sum,variance,rms,pdens,pcount,quantile:p,minority,majority,entropy] which shall be derived from the attribute. For features nmin:n and nmax:n, n (>0) and for feature quantile p ([0,1]) must be specified
-limit2D clipping window
Type: opals::GridLimit
Remarks: optional
If no user defined limits are specified or -limit is even skipped, the OPALS Data Manager (ODM) extents are used. Rounding is enabled by default in case the limits are derived from the ODM and can be enforced for user defined limits (keyword: round).
GridLimit: Defines xy-limits for output grid/raster datasets. The limit coordinates specified by left/lower/right/upper either refer to pixel centers (default) or corners, and may optionally get rounded to multiples of the grid size.
Syntax: ['center'|'corner']['round']['(' left lower right upper ')']
-filterModify the input using a (tree of) filter(s)
Type: opals::String
Remarks: optional
Text string describing a (tree of) filter(s) using the WKT filter syntax.
-noDatanodata value indicating void pixels
Type: opals::NoDataType
Remarks: default=max
Value representing an undefined value in the output grid model.
NoDataType: Defines or disables (use 'none') the nodata value for the output raster. The nodata values can be a specific value or a type independent label, such as, 'min', 'max' and 'nan'. Those labels will be translate to values based on the raster band type. See the OPALS Docu (opals::NoDataType) for more Details.
Syntax: none | min | max | nan | <value>
-procModereal or integer processing mode
Type: opals::HistoMode
Remarks: default=automatic
Possible values:  
  automatic ... derived mode from attribute type
  real ........ allow arbitrary bin width values
  integer ..... limits bin width and centers bins to natural numbers
For features aggregated into bins like minority and majority, the bin center is used as representative value. The same applies to procMode=integer, where the bin limits are shifted by half the bin size so that the corresponding integer value is located in the bin center. With procMode=real the bin limits are mutiples of the bin sizes, which is suitable for processing features of floating point (real) type. In automatic mode the module selects real or integer procMode based on the attribute type.
-multiBandif multiband set to true then multiple bands will be used instead of multiple files.
Type: bool
Remarks: default=0
When using multiband grid features will be stored in multiple bands instead of multiple files.Features will be saved in the same order as user input.For example if -feature sigma0 slope then Band1=sigma0 and Band2=slope

Examples

The data set fullwave2.fwf used in the following examples is located in the $OPALS_ROOT/demo/ directory. The data set contains full waveform ALS point data (x, y, z, GPS time, amplitude, echo width, echo number, echo qualifier) of a partially wooded area. This module requires an OPALS data manager file as input, which can be generated by using Module Import as follows:

opalsImport -inf fullwave2.fwf -iFormat fwf -coord_ref_sys EPSG:31256

Note: The following figures have been generated by applying Module ZColor to the output files (using the default color palette).

Example 1:

In this example, a point density map is produced (output: pdens.tif).

opalsCell -inf fullwave2.odm -outFile pdens.tif -feature pdens -cel 2.0

The file format (GTiff) is estimated from the file extension. The feature pdens (point density) is specified and quadratic cells with a size of 2.0 m are used for accumulation. In this case, the selected attribute is not relevant, because just the number of points per cell (divided by the cell area) determines the result. The extents are determined from the bounding box of the entire ODM point data set.

Point density map considering all echoes

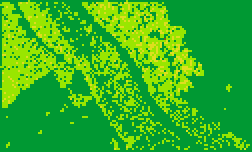
Since all echoes are considered, the regions with multiple echoes (i.e.
vegetation) show a higher point density.

Example 2:

In this example, two raster models are derived from the amplitude values of the first echoes for the features min and max (output: amplFirst_min.tif and amplFirst_max.tif).

opalsCell -inFile fullwave2.odm -outFile amplFirst.tif -attribute Amplitude -feature min max -cel 2.0 -filter Echo[First]

The file format (GTiff) is estimated from the file extension. The two output files names are based on the specified outFile and the features. As attribute the amplitude is selected. A filter is specified in such a way that only first echoes are considered. Quadratic cells with a size of 2.0 m are used for accumulation. The extents are determined from the bounding box of the entire ODM point data set.

Minimum (left) / maximum (right) values of the amplitude considering the first echoes

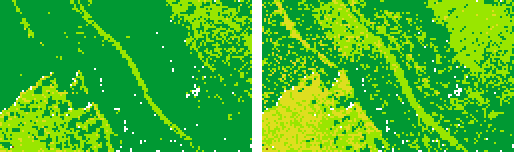
As expected, in vegetated areas, the first-echo-amplitudes tend to be smaller.

Example 3:

In this example, two raster models are derived from the echo width values of the first/last echoes for the feature max (output: maxEchoWidthFirst.tif and maxEchoWidthLast.tif).

opalsCell -inFile fullwave2.odm -outFile maxEchoWidthFirst.tif -attribute EchoWidth -feature max -cel 2.0 -filter Echo[First]
opalsCell -inFile fullwave2.odm -outFile maxEchoWidthLast.tif -attribute EchoWidth -feature max -cel 2.0 -filter Echo[Last]
opalsCell -inFile fullwave2.odm -outFile maxEchoWidthBig.tif -attribute EchoWidth -feature max -cel 2.0 -filter "Generic[EchoWidth > 4.5]"

The file format (GTiff) is estimated from the file extension. As attribute the echo width is selected. Filters are specified to select (i) only first echoes, (ii) only last echoes, or (iii) only echoes with a width greater than 4.5ns. Please note that quoting the filter string is necessary in the latter case due to the embedded blanks and special characters. Quadratic cells with a size of 2.0 m are used for accumulation. The extents are determined from the bounding box of the entire ODM point data set.

Maximum values of the echo width considering the first (left), last (middle), or big (right) echoes

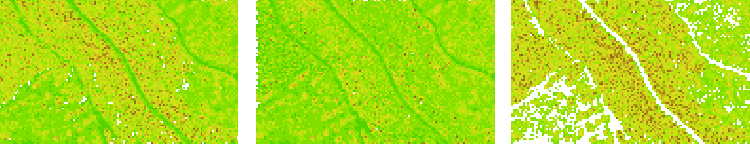
Comparing the two models, one can clearly see that high echo widths are occurring rather at first echoes than at last echoes.

Example 4:

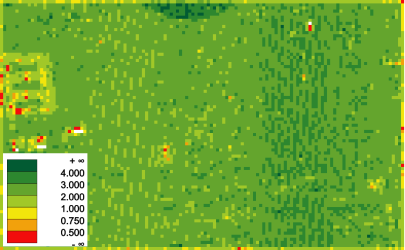
This examples illustrates the multiple input ODM file capabilities of module Cell using the demo data strip*1.laz. As a prerequisite, import the data files into separate OPALS data managers using the following commands:

opalsImport -inFile strip31.laz -coord_ref_sys EPSG:25833
opalsImport -inFile strip21.laz -coord_ref_sys EPSG:25833
opalsImport -inFile strip11.laz -coord_ref_sys EPSG:25833

To compute the point density of an entire flight block multiple input ODM files can be specified in a single program call. A colourized version of the resulting point density map is illustrated in the below figure:

opalsCell -inFile strip*1.odm -outFile blockPtDens.tif -cellSize 2.5 -feature pdens -filter echo[last]
opalsZColor -inFile blockPtDens.tif -palFile densityPal.xml -scalePal 5
Combined (block) point density of strip 11, 21 and 31
opalsZColor is the executable file of Module ZColor
Definition: ModuleExecutables.hpp:253
@ pdens
point density estimate
Definition: GridFeature.hpp:13
@ EchoWidth
Full width at half maximum [ns].
@ coord_ref_sys
default coordinate reference system (EPSG Code, WKT string or PRJ-File)
@ last
last stage to be processed (opalsStripAdjust)
opalsImport is the executable file of Module Import
Definition: ModuleExecutables.hpp:113
@ strip
strip ID of an image (opalsStripAdjust)
@ scalePal
scale factor to be applied to the given palette (opalsZcolor)
@ Amplitude
Linear scale value proportional to the receiving power.
opalsCell is the executable file of Module Cell
Definition: ModuleExecutables.hpp:23
@ filter
string to be parsed in construction of DM::IFilter (various modules)
@ feature
Use a statistic feature of the boundary gap points for filling.
@ palFile
palette file (opalsZcolor)